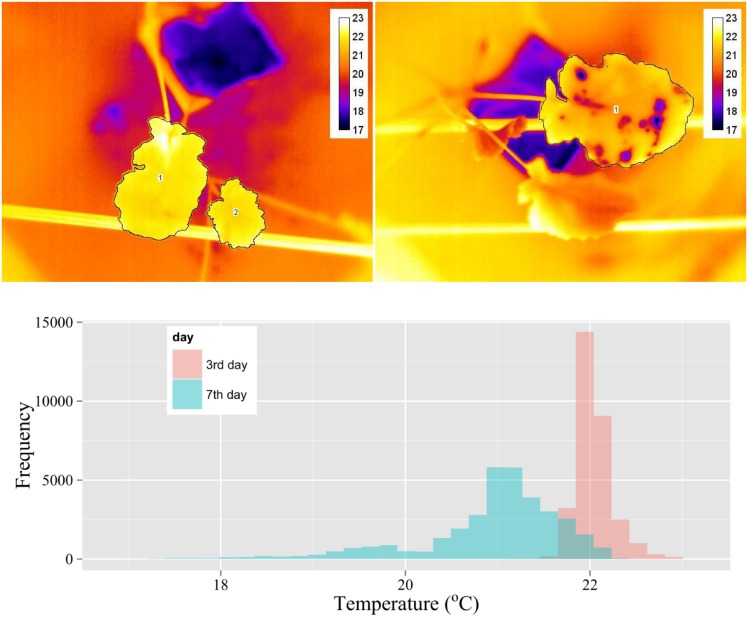
Fig 2. Thermal images of oilseed rape leaves inoculated with Alternaria brassicae after 3 (left) and 7 (right) d after inoculation (dai) with selected areas representing analysed leaf surfaces (temperature values in the legend in °C). Below, a histogram of temperature distribution of the leaves for these two days.
Areas of the leaves used for histogram construction (two leaves for 3 dai and one leaf for 7 dai) are shown selected with polygon line.

