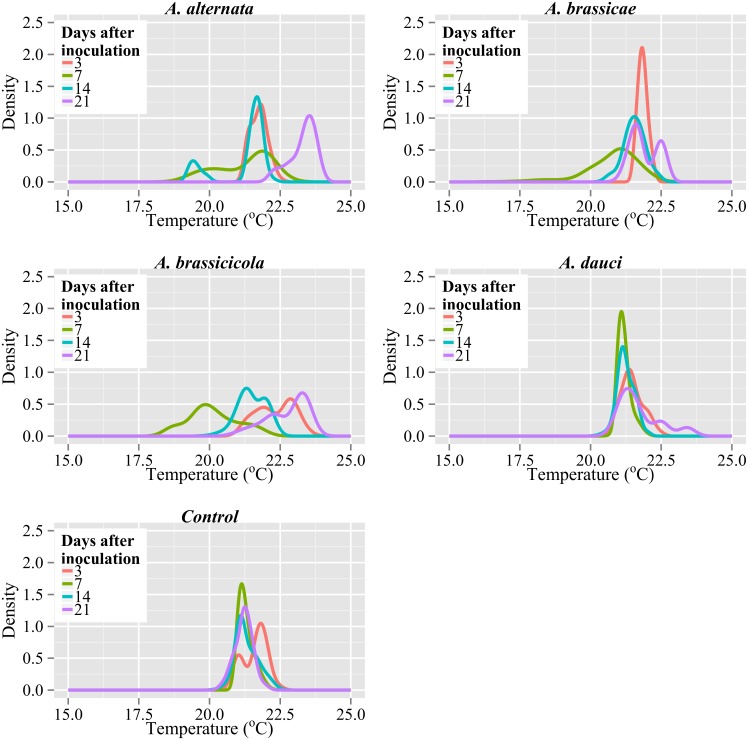
Fig 4. Density plots of leaf temperature distributions on succeeding days after inoculation for various types of inoculations.
. A kernel density curve is shown estimating population distribution based on the sample data. The adjust parameter, which is responsible for the amount of smoothing, was set to 4.

