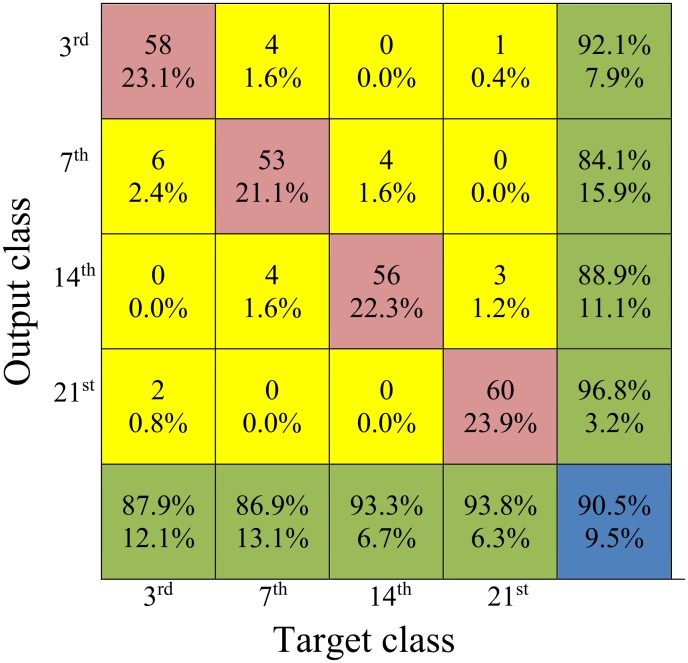
Fig 8. Confusion matrix obtained with 10-fold cross-validation for the back-propagation neural network model for the studied days after inoculation (dai).
The upper number in each entry of the matrix is the average number of actual recognised classes in testing mode; the bottom one (its percentage) refers to the total number of cases used in testing (251). The diagonal entries of the matrix represent the mean quantities of the properly recognised cases (the upper value) and also their ratios with respect to the total representation of all testing data (the lower values are expressed as a percentage). Each entry outside the diagonal indicates an error (the number of misclassifications and its relative value). The last column of the matrix represents the total percentage measure of accuracy of actual recognition for the class indicated by the classifier. The upper number in this column represents the ratio of the number of the properly recognised cases to the total number of cases indicated by the particular output. The bottom numbers in the last column represent false alarm ratios. The last row of the matrix represents the ratios of the number of properly recognised cases to the total number of true cases (targets). The bottom numbers in this row are the misclassification ratios (the complement of sensitivity to one).

