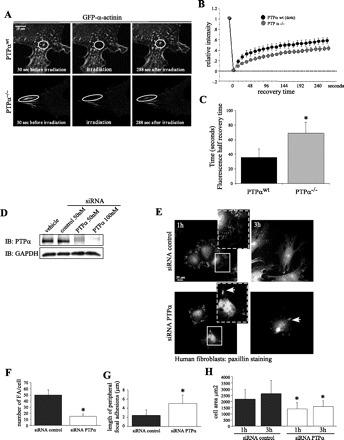
Fig. 2.

PTPα regulates α-actinin dynamics. GFP-α-actinin dynamics were analyzed by fluorescence recovery after photobleaching (FRAP) in transfected PTPαwt and PTPα−/− cells. A: time-lapse images of GFP-α-actinin at cell periphery before (30 s) and after (288 s) photobleaching. In PTPαwt cells, small “dots” and larger “mature” α-actinin were selected for photobleaching. PTPα−/− cells displayed mostly supermature FA (larger α-actinin aggregates), which were irradiated. B: FRAP of PTPαwt and PTPα−/− cells. Values are means ± SE. C: fluorescence half-recovery time. Values are means ± SD calculated from 9–10 curves for each category. *P < 0.01 vs. PTPαwt. D: Western immunoblot (IB) assessment of PTPα knockdown by 50–100 nM short interfering (siRNA). E: human gingival fibroblasts transfected with siRNA against PTPα or control siRNA and immunostained for paxillin. Cells were allowed to spread for 1 and 3 h. F and G: quantification of numbers and length of FA in fibroblasts treated with PTPα-siRNA and control siRNA. *P < 0.01 vs. siRNA control. H: cell area. Values are means ± SD of 40 independent measurements. *P < 0.05 vs. respective (1 and 3 h) siRNA control.
