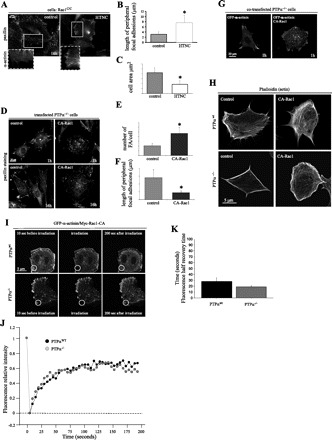
Fig. 7.

Rac1 rescues FA remodeling in PTPα−/− cells. A: fluorescent images of α-actinin and paxillin distribution in Rac1 conditional fibroblasts (Rac1C/C) treated with HNTC peptide (polyhistidine, HIV TAT fusion protein and nuclear localization sequences fused to the Cre cDNA) to generate Rac1-null cells or used as a control (same cells treated with vehicle alone, i.e., no HNTC peptide). Where indicated, cells were transfected with GFP-α-actinin and allowed to spread for 16 h and fixed with 4% paraformaldehyde. Cells were then immunostained using anti-paxillin antibodies. B and C: length of peripheral FA and cell area of control and HTNC-treated cells. *P < 0.05 vs. control. D: fluorescent images of PTPα−/− cells transfected with myc-tagged constitutively active (CA) L61 Rac1 (CA-Rac1) or vehicle control, allowed to spread for 1 and 16 h, and stained with anti-paxillin antibodies. E and F: number of FA per cell and length of peripheral FA in control and CA-Rac1 transfected cells. *P < 0.05 vs. control. G: PTPα−/− cells transfected with CA-Rac1 and FA and imaged by cotransfection with GFP-α-actinin. CA-Rac1 induces FA turnover and de novo FA formation. H: fluorescent images of PTPαwt and PTPα−/− cells transfected with CA-Rac1, stained with Alexa-phalloidin, and allowed to spread for 4 h. I: GFP-α-actinin dynamics were analyzed by fluorescence recovery after photobleaching in cotransfected (GFP-α-actinin and CA-Rac1) PTPαwt and PTPα−/− cells. Images represent time lapse of GFP-α-actinin at the cell periphery before (10 s) and after (0 and 200 s) photobleaching. Circles represent bleached area. J: rate of fluorescence recovery (measured every 5 s) in a representative experiment as analyzed by Zeiss LSM Image Examiner software. Intensity at each time point was normalized to a control area of equivalent size (unbleached area). K: half-recovery time of 3 curves for each group of cells (PTPαwt and PTPα−/−). Values are means ± SE of 3 experiments. Values are not statistically different (by Student's t-test).
