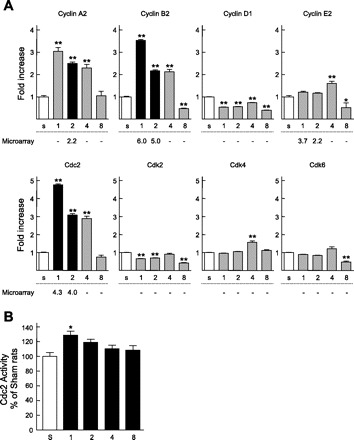
Fig. 3.

Expression levels of cell cycle-related genes and the activities of Cell division cycle 2 (Cdc2) in the remnant kidney. A: mRNA levels of Cyclin A2, Cyclin B2, Cyclin D1, Cyclin E2, Cdc2, Cyclin-dependent kinase (Cdk)2, Cdk4, and Cdk6. An equal amount of cDNA was pooled from the remnant kidney of each rat, and the expressional changes of mRNA were measured by real-time PCR and analyzed by the ΔΔCt method (where Ct is threshold cycle). Numbers below each column show the fold change in the microarray analysis; − indicates that expressional change was not significant in the microarray analysis. Open columns represent levels in sham-operated rats; black and gray columns represent results of the microarray analysis validated by real-time PCR analysis or not, respectively. B: kinase activities of Cdc2. Multiple comparisons were performed with Dunnett's 2-tailed test after a 1-way ANOVA. *P < 0.05, **P < 0.01, significantly different from sham-operated rats.
