
Fig. 4.
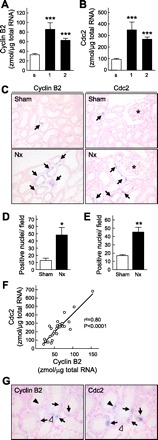
Detection of Cyclin B2 and Cdc2 in the kidney by real-time PCR and in situ hybridization analysis. A and B: mRNA levels of Cyclin B2 (A) and Cdc2 (B) were measured by real-time PCR. s, Sham-operated rats; 1 and 2, Nx rats at 1 and 2 wk after surgery. Multiple comparisons were performed with Dunnett's 2-tailed test after a 1-way ANOVA. ***P < 0.001, significantly different from sham-operated rats. C: in situ hybridization of Cyclin B2 (left) and Cdc2 (right). *, Glomeruli. Magnification ×200. D and E: Cyclin B2 (D)- and Cdc2 (E)-positive nuclei in the renal cortex were counted. *P < 0.05, **P < 0.01, significantly different from sham-operated rats. F: correlation between mRNA levels of Cyclin B2 and Cdc2. Linear regression analysis was performed, and the correlation coefficient (r) was calculated. G: in situ hybridization analysis of Cyclin B2 and Cdc2 with serial sections in Nx rats was carried out. Arrows, positive staining for both Cyclin B2 and Cdc2; open arrowhead, positive staining for Cyclin B2 without Cdc2; filled arrowhead, positive staining for Cdc2 without Cyclin B2.