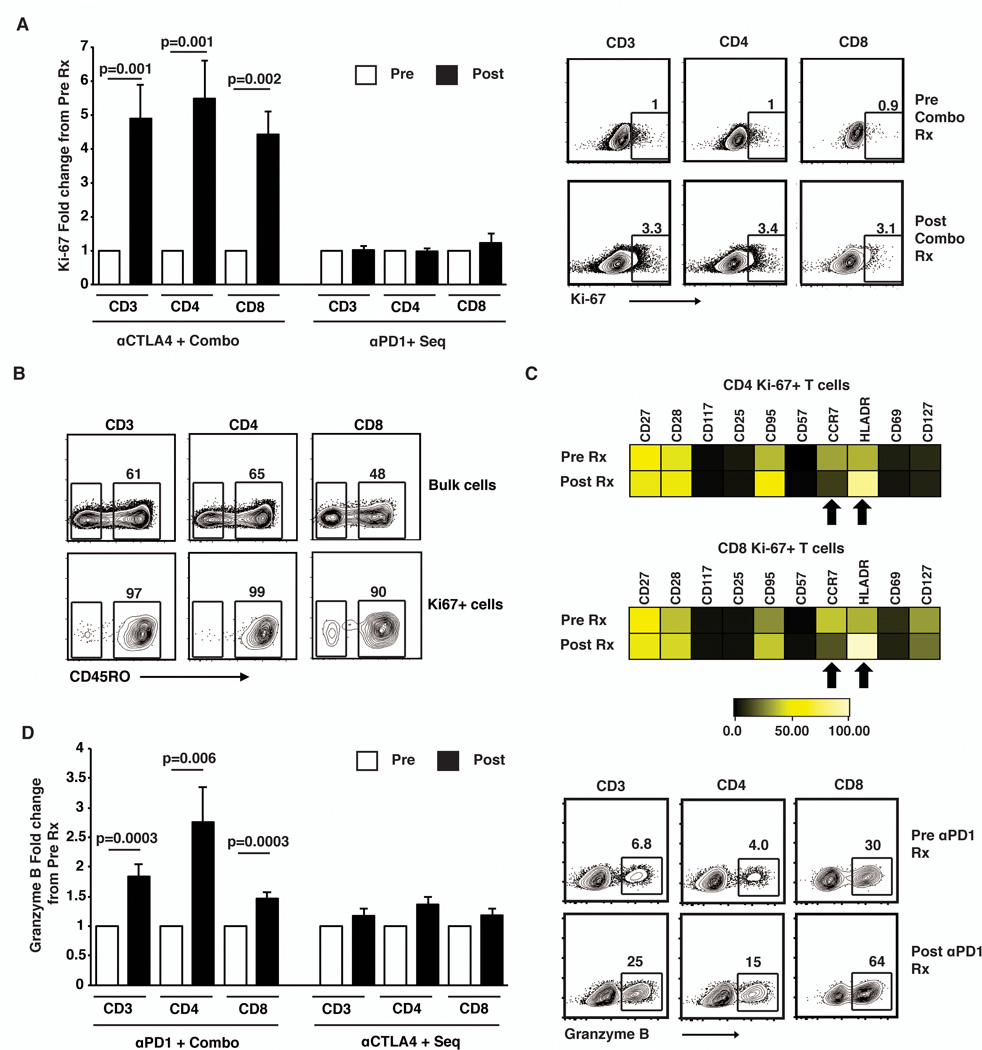
Figure 2.
Changes in T cell proliferation and cytolytic function following therapy with checkpoint blockade inhibitors.
Freshly collected frozen samples were used to for these assays. All pre and post therapy samples from the same patient were thawed at the same time, stained together using the same antibody cocktail and analyzed at the same time.
(A) Bar graph shows expression of Ki67 (mean and standard error of mean) in peripheral blood (CD3, CD4 and CD8 T cells) of patients (n=34) before (Pre-white bars) and after (Post-Black bars) therapy with either anti-CTLA4 and Combo therapy (n=15) or anti-PD1 and Sequential therapy (n=19). Flow cytometry plots on the right show a representative patient with increase in Ki67+ cells after combination therapy.
(B) Expression of T cell memory marker (CD45RO) in bulk T cells as well as Ki67 positive T cells after therapy in the same patient as in figure 2A.
(C) Single cell mass cytometry (CyTOF) analysis for expression of surface markers on CD3+CD4+ Ki67+ as well as CD3+CD8+ Ki67+ cells before (Pre Rx) and 3 weeks after (Post Rx) starting combination therapy with anti-CTLA4 and anti-PD1. The figure shows median MFI. Plot is representative of 3 similar patients (anti-CTLA4=2 and combination treated patients n=1).
(D) Expression of Granzyme B (mean and standard error of mean) in CD3 and CD8 T cells in peripheral blood of patients (n=34) before(pre) and after(post) therapy with anti-PD1 and Combo therapy (n=23) and those treated with anti-CTLA4 and Sequential therapy(n=11). The flow cytometry plot shows a representative patient.

