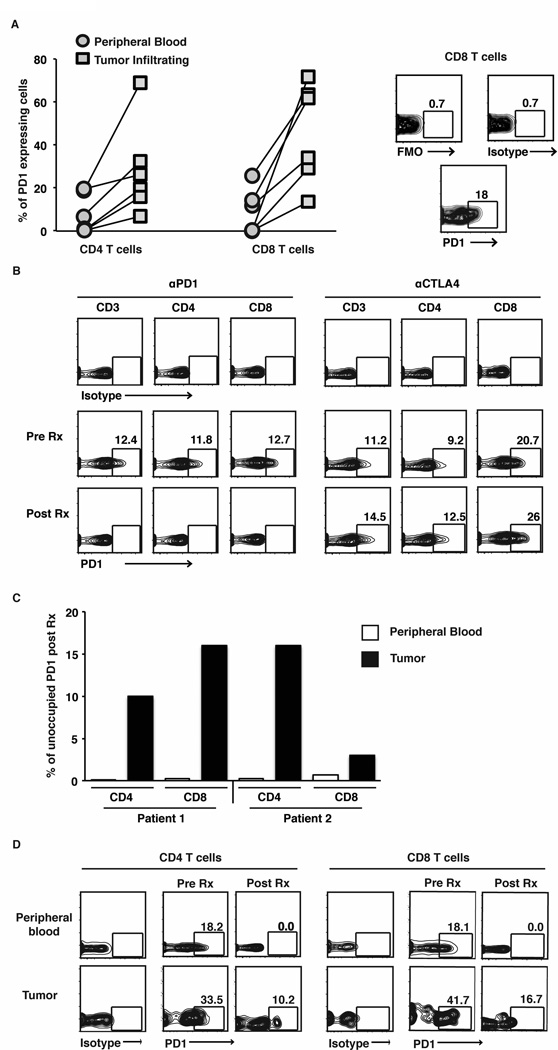
Figure 5.
PD1 expression and occupancy in patients treated with checkpoint blockade inhibitors.
PD1 surface expression was determined on tumor infiltrating lymphocytes and blood from patients (n=6 different patients). Cells were obtained from the tumor sample by manual dissociation. PBMCs obtained from the blood and the tumor tissue were stained and analyzed together.
(A) Graph in the left panel shows expression of PD1 on CD4 and CD8 T cells in the tumor as well as peripheral blood T cells drawn at the same time. Panel on the right is a representative flow cytometry plot showing controls (Fluorensence minus one; FMO and Isotype) as well as PD1 staining on CD8 T cells.
(B) Expression of PD1 on CD3, CD4 and CD8 T cells in peripheral blood of representative patients before and after treatment with anti-PD1 and anti-CTLA4.
(C). Bar graph shows percent PD1 on CD4 and CD8 T cells that was unoccupied after therapy with anti-PD1 compared to that prior to therapy in 2 separate patients. Bar in white shows data from peripheral blood T cells and bar in black shows data from tumor infiltrating T cells.
(D) Expression of PD1 on peripheral blood and tumor infiltrating T cells in a patient before and after combination therapy with anti-CTLA4 and anti-PD1 therapy. Data are representative of similar findings on two patients.

