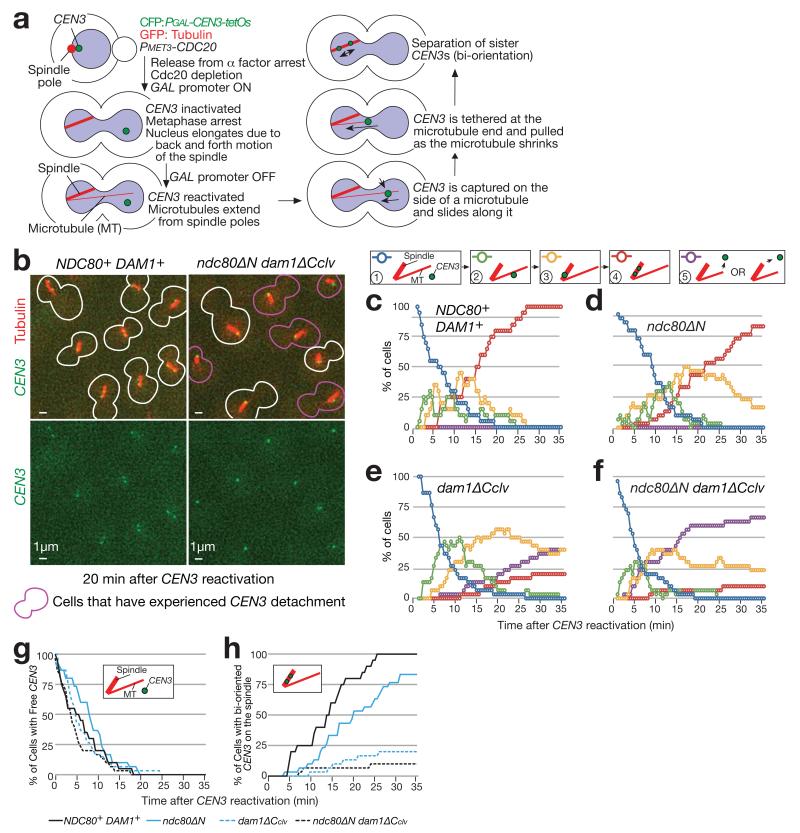
Figure 2. The KT attaches normally to the MT lateral surface but detaches afterwards, when the Dam1 C-terminus and the Ndc80 N-tail are deleted.
(a) Experimental system to analyse the individual KT–MT interaction 3.
(b–h) NDC80+ DAM1+ (T9162), ndc80ΔN (T8049), dam1-TEVsites (producing Dam1ΔCclv; T8921) and ndc80ΔN dam1-TEVsites (T8965) cells with PGAL-TEV (except for T8049) PGAL-CEN3-tetOs TetR-3×CFP GFP-TUB1 PMET3-CDC20 were treated with α factor for 3 h and released to fresh media with methionine (for Cdc20 depletion), in the presence of galactose (for TEV expression and CEN3 inactivation). After 3 h, cells were suspended in medium with glucose (for CEN3 reactivation) and images were acquired every 30 sec. b shows representative images acquired at 20 min after CEN3 reactivation. Graphs show percentage of cells at each step of the KT–MT interaction (c–f); Purple lines (step 5) show cumulative percentage of CEN3 detachment; CEN3 detachment was followed by recapture by a MT, but such recapture was not included in counting for other steps. Percentage of cells at steps 1 and 4 are compared in four strains (g and h). n= 30 cells were analysed for each strain. Data represent one out of two independent experiments.

