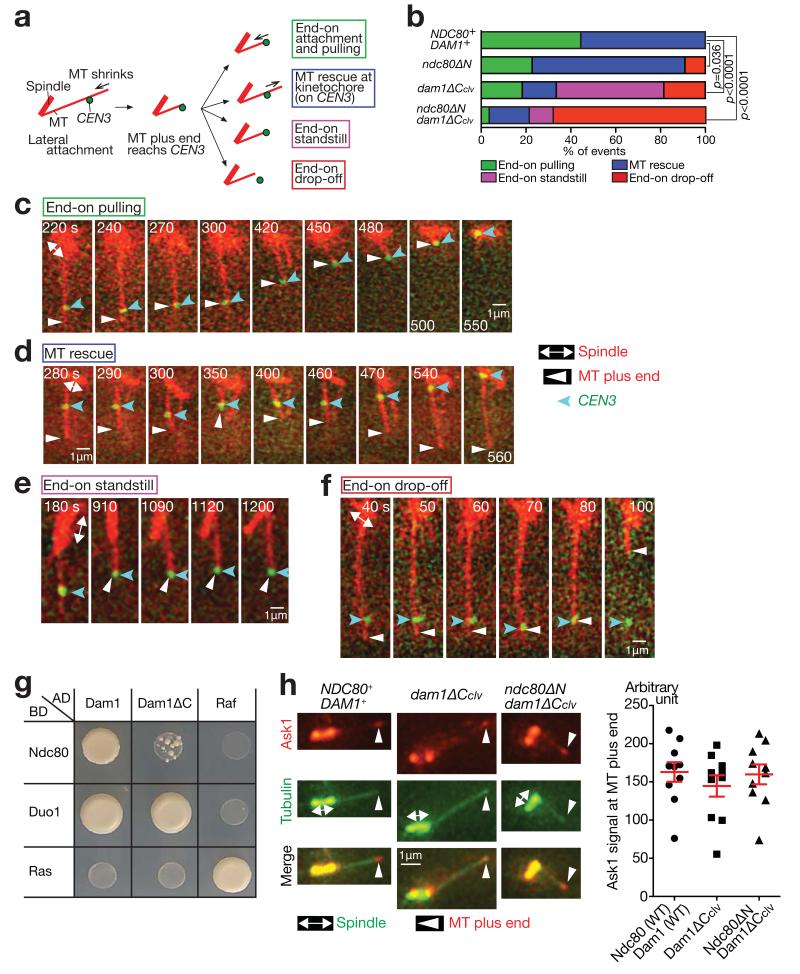
Figure 3. The KT often detaches from the MT end, when the Dam1 C-terminus and the Ndc80 N-tail are deleted.
(a) After the plus end of a shrinking MT had caught up with CEN3, four kinds of events were observed.
(b) Percentage of the events shown in a, in each strain. The four strains in Fig 2b–hwere treated as in Fig 2b–h, except that images were acquired every 10 sec. n= 27, 22, 27 and 28 events were analysed (from top to bottom). p-values (two tailed) were obtained by a chi-square test for trends. Data represent one out of two independent experiments.
(c–f) Examples of the end-on pulling (c, T9162), MT rescue (d, T8049), end-on standstill (e, T8921) and end-on drop-off (f, T8965), observed in b.
(g) Dam1 and Ndc80 interact physically in the two-hybrid assay, and this interaction requires the Dam1 C-terminus. Duo1 is a component of the Dam1 complex and serves as a control. Ras and Raf were also used as controls. AD, BD: fused with the transcription activation domain and the DNA-binding domain, respectively.
(h) The Dam1 C-terminus is dispensable for Dam1c accumulation at the MT end. NDC80+ DAM1+ (T8875), dam1-TEVsites (producing Dam1ΔCclv; T8915) and ndc80ΔN dam1-TEVsites (T8916) cells with PGAL-TEV CEN5-tetOs TetR-3×CFP ASK1-4×mCherry Venus-TUB1 were treated with α factor for 3 h and released to fresh media in the presence of galactose (for TEV protease expression). Images were acquired 70 min after release. Ask1 is a component of Dam1c. Representative cells in metaphase (left). CEN5 was on the spindle, not at the indicated MT end. Quantification of Ask1 signals at the MT ends (right). The maximum Ask1 signals at the MT ends during image acquisition were quantified in n= 10 cells of each strain. Bars represent mean ± SE. Data represent one out of two independent experiments.

