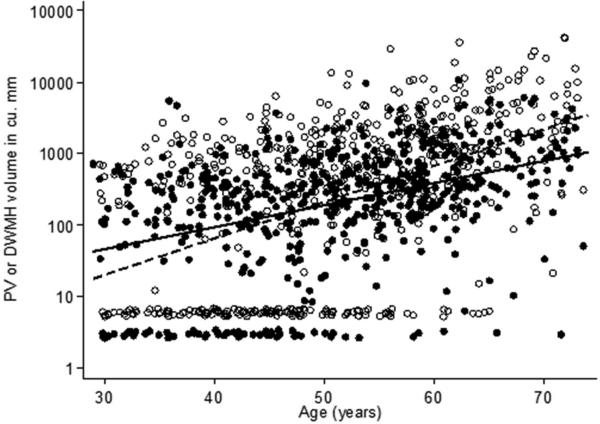
Figure 2. Scatter plot of DWMH and PV vs. age.
Deep white matter hyperintensity volumes (filled circles and solid line) and periventricular hyperintensity volumes (hollow symbols and dotted line) on the logarithmic scale vs. age and best fit unadjusted linear fit. Volumes below the level of detection have been plotted at the level of half the minimum detectable volume. Small random numbers have been added to the plotted points so that overlaid symbols can be seen separately. The unadjusted slope for DWMH (7% higher volume per year) was lower than that for PV (12% higher volume per year, p < 0.001)

