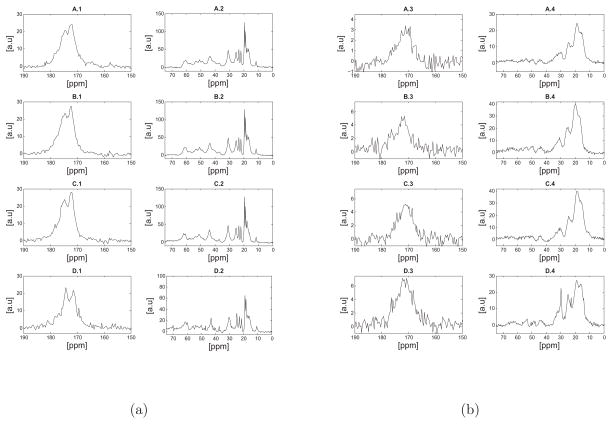
Figure 3.
a) Direct polarization (DP) 13C NMR spectra of hydrated (a) and lyophilized (b) bovine nuchal ligament elastin samples at 37°C. For each set of figures (a, or b) the spectra shown are as follows: A) sample 1 purified by the autoclaving method38, B) sample 3 purified by the Starcher method40, C) sample 2 purified by the alkaline extraction method39 and D) unpurified elastin. As discussed in the text, the spectra appear remarkably similar in terms of the chemical shifts, however a signal enhancement of the valine or proline-Cβ at approximately 30.0ppm was observed in D-2. Note that differences shown in Table 1 in regards to amino acid concentration may not be reflected in a simple difference in signal intensity in the NMR spectra due differences in mass of the sample packed into the rotor or potential structural heterogeneity across the samples. The reader should note the different scales used in the spectra, as they were all scaled such that the standard deviation of the noise was set to unity.

