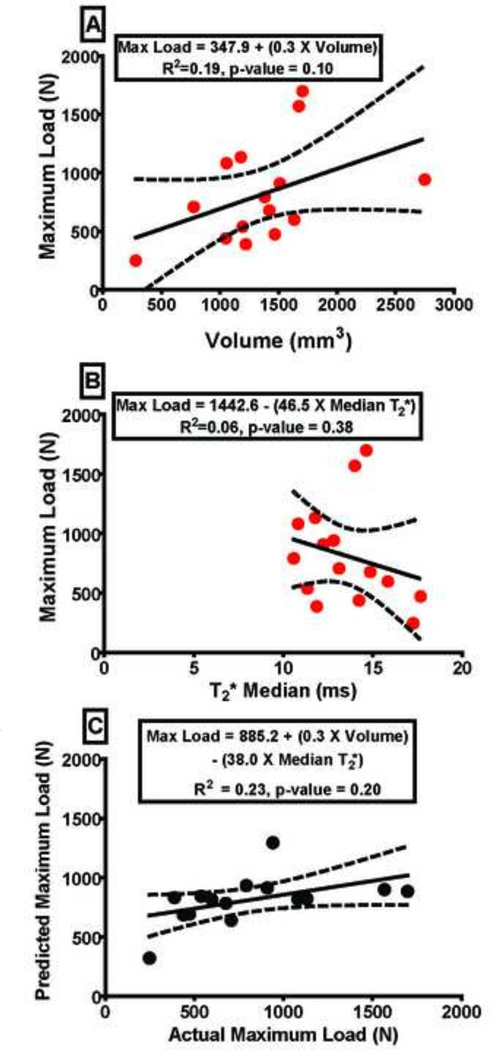
Figure 1.
A) The ligament maximum load as a function of ligament volume and B) ligament maximum load as a function of ligament median T2* in linear regression models. C) Actual ligament maximum load versus predicted ligament maximum load determined using a multiple regression model as a function of the linear combination of ligament volume and median T2*. Dashed lines represent 95% confidence interval. Maximum load prediction equations for the intact ACLs as a function of volume (VOL), median T2*, and the linear combination of VOL and median T2* are inlaid in the graphs.

