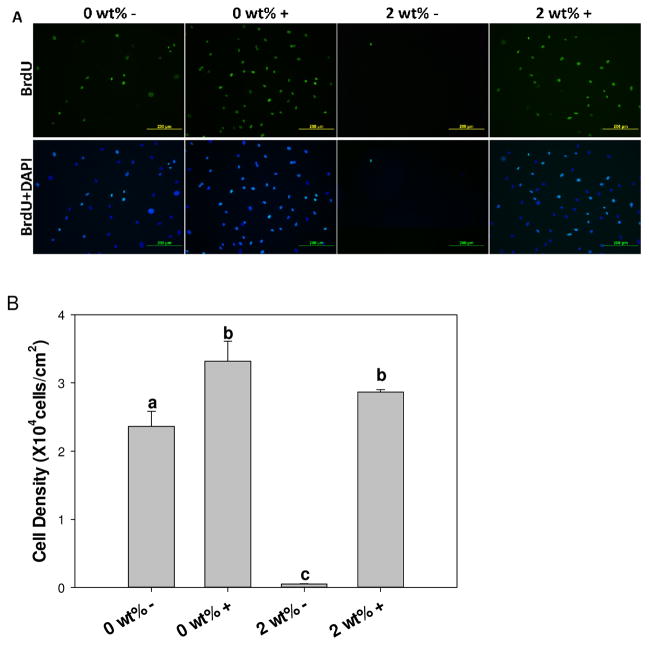
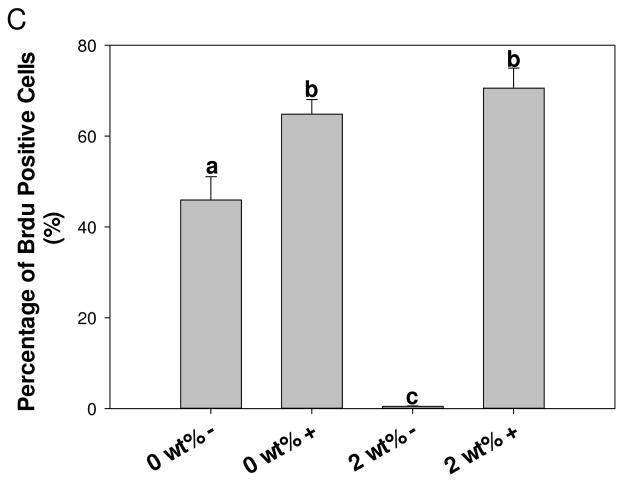
Figure 6.
Immunofluorescent staining of BrdU (green) and DAPI (blue) of primary rat dermal fibroblasts exposed to 0 and 2 wt% DMA hydrogel extract with (+) or without (−) 100 U/mL of catalase (A). Rat dermal fibroblast cell density (B) and percentage of BrdU positive cells (C) exposed to the extract of 0 or 2 wt% DMA hydrogel with (+) or without (−) 100 U/mL of catalase. Letters a–c indicate statistical equivalence for samples labeled with the same letter.


