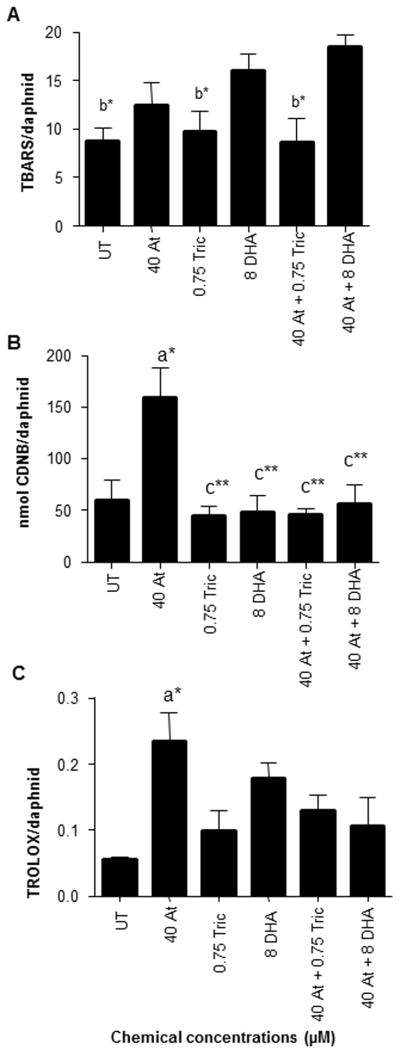
Fig. 5. Measurement of GST activity, antioxidant capacity and ROS (TBARS) induced by chemicals and chemical mixtures.

Alteration of ROS and protective enzymes by HR96 modulators were determined using the following measurements (A) TBARS assay for lipid peroxidation (B) GST activity determined by CDNB and (C) TROLOX assay for antioxidant mechanism. Data are provided as mean ± SEM (n = 4). Statistical significance was determined by ANOVA followed by Tukey’s multiple comparison test with an ‘a’ refering to groups that are different from UT, ‘b’ refering to groups that are different from DHA+Atrazine, and ‘c’ referring to groups different from atrazine treatments. Asterisks indicate the level of statistical significance (*p < 0.05, **p < 0.01).
