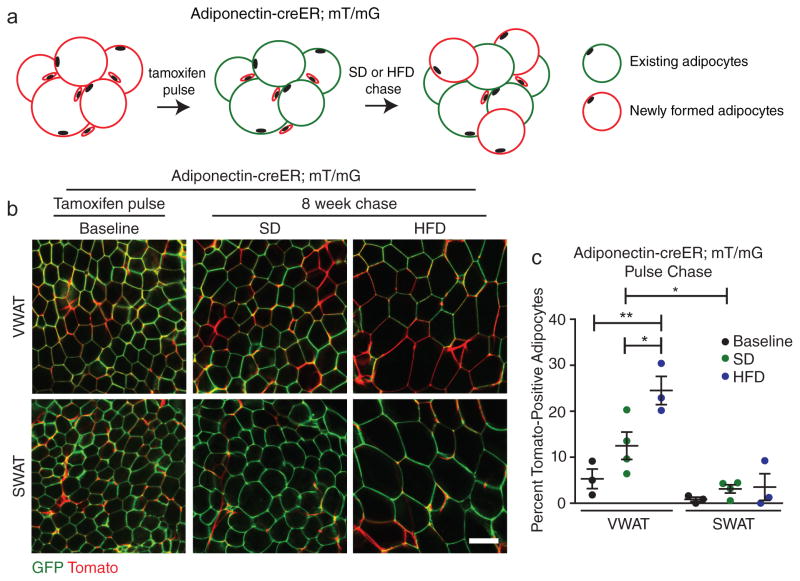
Figure 1. High-fat diet feeding induces depot-specific adipocyte hyperplasia.
(A) Experimental scheme for analysis of in vivo adipogenesis with the Adiponectin-creER; mT/mG mouse model. (B–C) Representative images (B) and quantification (C) of adipocyte tracing in Adiponectin-creER; mT/mG mice after tamoxifen treatment followed by 8 weeks on the indicated diets (n = 3 mice for baseline and HFD, n = 4 mice for SD). Note that the vasculature remains mTomato-positive in the images in (B). Significance between the indicated groups in (C) was calculated using a two-tailed student’s t-test. Exact p-values are listed in Supplementary Table 1. Error bars represent mean ± s.e.m. * (P<0.05), ** (p<0.01). Scale bar in (B) is 100μm. HFD: high-fat diet, SD: standard diet, mT/mG: membrane tomato/ membrane GFP.

