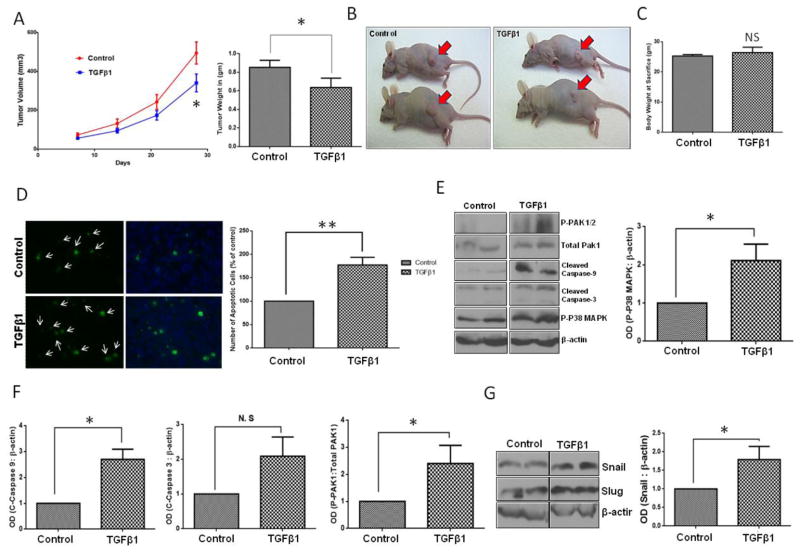
Figure 1. TGFβ1 overexpression results in the growth inhibition of prostate tumor xenografts.
A. Figure showing tumor volume (left) and weight (right) analysis of the PC3 tumor xenografts bearing either Ad-GFP or Ad-TGFβ1 overexpression. B. Representative images of xenograft tumor in both control and TGFβ1 overexpression groups (n= 6) C. Bar graph representing mice body weight on the date of tumor collection. D. Pictures showing TUNEL staining (green), DAPI (blue) and bar graph indicating prostate cancer cell apoptosis in tumor xenograft sections taken from either control or TGFβ1 overexpressing tumors (n= 6). E. Western blot images of control and Ad-TGFβ1 expressing PC3 tumor xenograft lysates showing expression levels of p-p38 MAPK, cleaved caspase 3, cleaved caspase 9, p-PAK1, and total PAK1 normalized to β-actin (left) and bar graph representing optical densitometry measurements of p-p38-MAPK expression normalized to β-actin (right) (n= 4). F. Bar graphs representing optical densitometry measurements of cleaved caspase-9, cleaved caspase-3 and phosphorylated Pak1expressions in prostate tumor xenografts normalized to β-actin (n= 3). G. Western blot image of Snail and slug expressions in prostate tumor xenografts (left) and bar graph representing optical densitometry measurements of Snail expression (right) normalized to β-actin (n= 3).*p<0.05 and **P<0.01, Data presented as Mean ± SEM.

