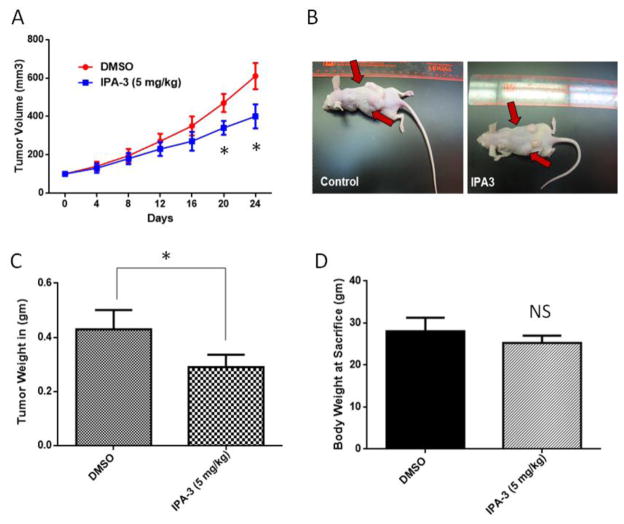
Figure 2. Treatment with IPA 3 results in the growth inhibition of prostate tumor xenografts.
A. Panel showing tumor volume measurements from Day 0 to Day 24 (left) and representative pictures of tumor xenograft from DMSO or IPA 3 (5mg/Kg) treatments groups on Day 24 (n= 4–5) (right). B. Bar graph showing weights of tumors from mice treated with either DMSO or IPA 3 (5mg/Kg) collected on Day 24. C. Bar graph representing mice body weight on the date of tumor collection. (n= 4–5). *p<0.05 and **P<0.01, Data presented as Mean ± SEM.

