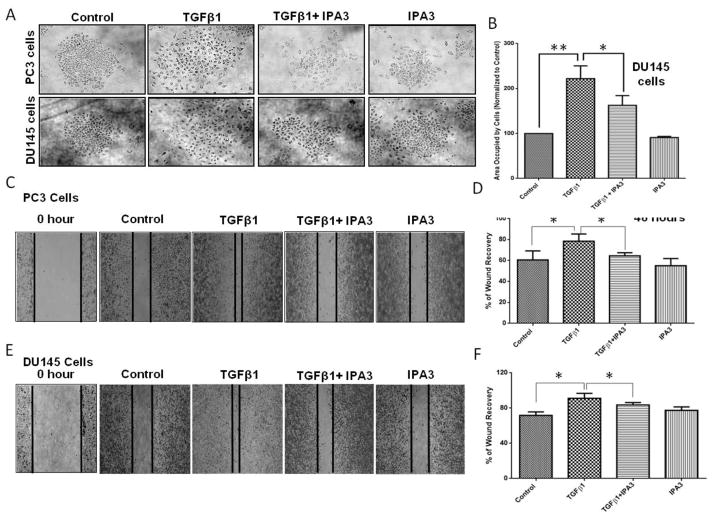
Figure 5. Pharmacological inhibition of Pak1 with IPA 3 inhibits TGFβ1-induced EMT-associated morphological changes, cell scattering, and motility in prostate cancer cells.
A. Representative images of PC3 and DU145 cell scattering following 72 h treatments with TGFβ1 (5 ng/ml), or IPA 3 (15 μM), or a combination. B. Bar graph showing quantification of the cell scattering in DU145 cells as treated above (n= 4). C and D. Representative images and bar graph of PC3 cell migration following 48 h treatments of TGFβ1 (5 ng/ml), IPA 3 (15 μM), or a combination (n= 4). E and F. Representative images and bar graph of DU145 cell migration following 48 h treatments of TGFβ1 (5 ng/ml), IPA 3 (15 μM), or a combination (n= 4). *p<0.05 and **P<0.01, Data presented as Mean ± SEM.

