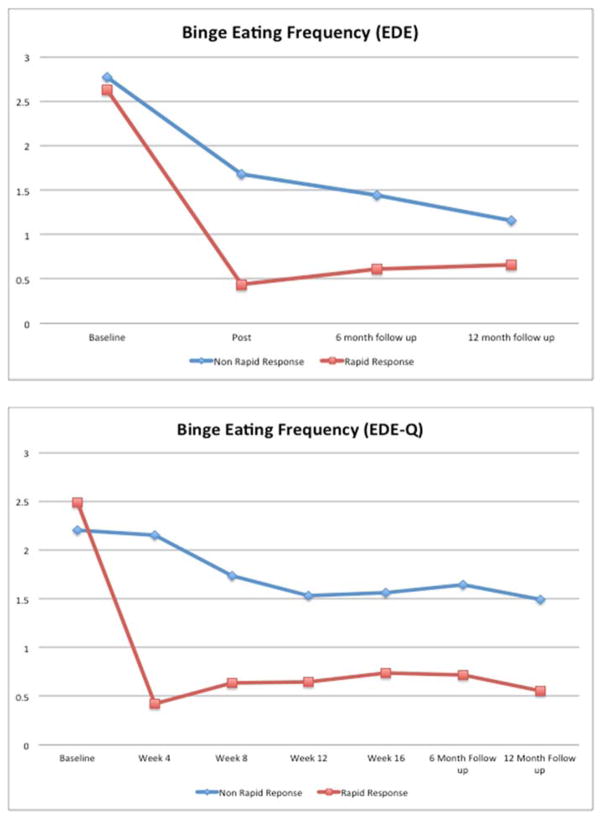
Figure 1. Frequency of Binge-eating Over Time by Rapid Response Status.
Frequency of binge-eating (per week) by participants with rapid response versus without rapid response over time based on two complementary assessments. The top figure shows binge-eating frequency during the major assessment points through the 12-month follow-up. The bottom figure shows binge-eating frequency based on the Eating Disorder Examination – Questionnaire monthly during the course of treatment and at 6- and 12-month post-treatment follow-up assessments. The data shown are based on estimated marginal means (derived from mixed models analyses of log transformed binge-eating data) for all N=104 participants.

