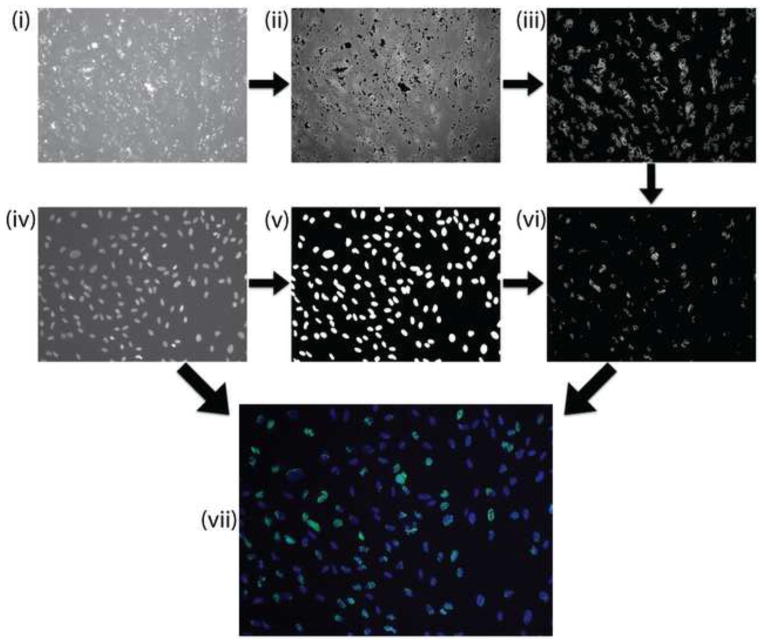
Fig. 3. Quantification of PPARG expressing cells.
Post-processing of images was performed to remove false signal and allow for batch analysis of beacon signal. To begin (i)→(ii), bright debris noise was removed using a custom, ImageJ macro script. (ii)→(iii) MATLAB’s image processing toolbox was used to detect positive beacon signals above a given threshold and remove background signal. (iv)→(v) Nuclei were detected and their perimeter expanded by 2 pixels to encompass cytoplasmic beacon signal in the perinuclear region. (vi) Beacon signal overlapping this region was used to designate positive cells. (vii) Finally the beacon signals were paired with their respective nuclei for calculating the percentage of PPARG+ cells.

