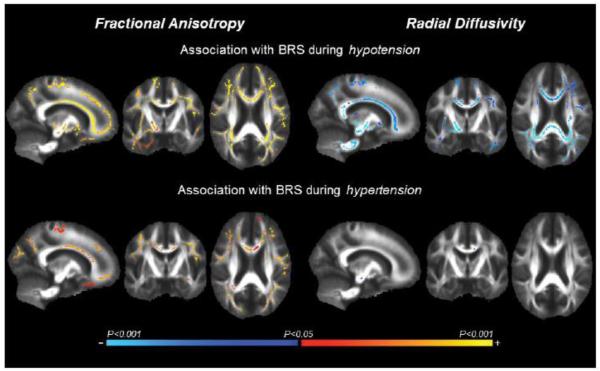
Figure 2.
Tract-based spatial statistic (TBSS) maps exhibit white matter fiber tracts with fractional anisotropy (left) and radial diffusivity (right) that associated with baroreflex sensitivity (BRS), as assessed separately during hypotension (top) and hypertension (bottom). The color bar illustrates the directionality and P-value of the associations.

