
Figure 4.
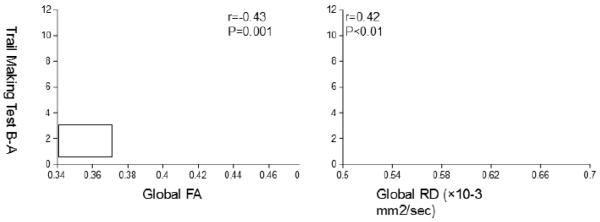
Scatter plots show simple correlations of fractional anisotropy (FA) (left) and radial diffusivity (RD) (right) with the scores from the Trail Making Test B-A index. Mean values of FA and RD were extracted from the global WM skeleton that associated with both carotidfemoral PWV and baroreflex sensitivity (see the bottom of Figure 1).