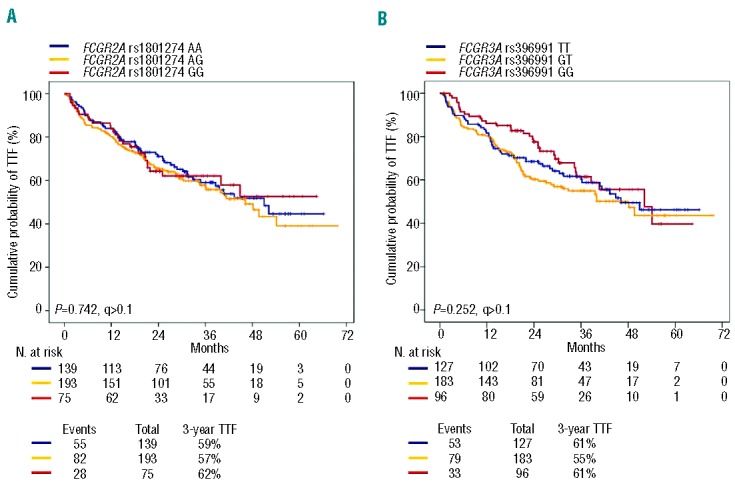
Figure 2.

Kaplan-Meier estimates of time to treatment failure in the pooled treatment arms according to FCGR2A and FCGR3A genotypes. (A) Comparison of time to treatment failure (TTF) between patients homozygous for the common FCGR2A rs1801274 allele (blue line), patients heterozygous for the FCGR2A rs1801274 genotype (yellow line), and patients homozygous for the variant FCGR2A rs1801274 allele (red line). (B) Comparison of TTF between patients homozygous for the common FCGR3A rs396991 allele (blue line), patients heterozygous for the FCGR3A rs396991 genotype (yellow line), and patients homozygous for the variant FCGR3A rs396991 allele (red line). P: P values by log-rank test.
