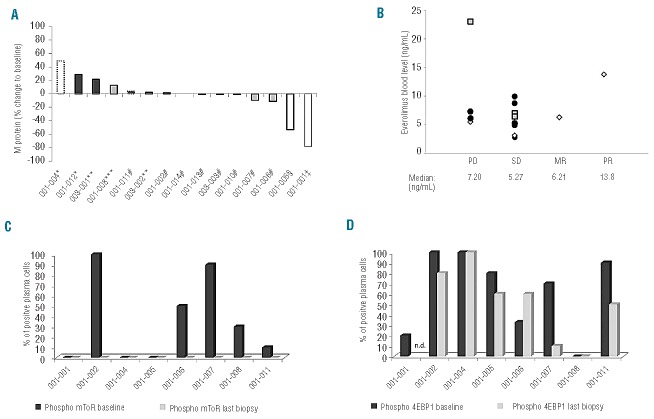
Figure 2.
The waterfall plot shows the best response at time of assessment of the 12 available patients (A). The shading of the bars indicates the different drug level cohorts: white is cohort 1 (5 mg), light gray cohort 2 (7.5 mg) and dark gray cohort 3 (10 mg). Black frames represent serum M protein, black spotted frames total IgA (in cases without measurable serum M protein) and a gray frame represents urinary M protein as a disease marker. Seven patients had clinical benefit, achieving stable disease (#), minor response (ǂ) or partial response (§). Five patients showed progressive disease as defined by IMWG criteria (*), early withdrawal due to hyperviscosity (**) or growing spinal tumor (***). The everolimus blood levels of patients (average of all measurements in a particular patient) grouped according to the best clinical status achieved (B). Although the patient with a partial response had the second highest blood level, the data show no obvious correlation between drug level and efficacy as indicated by comparable median blood levels for all groups [white diamond: dose level 1 (5 mg daily), gray quadrangle: dose level 2 (7.5 mg daily), dark gray circle: dose level 3 (10 mg daily)]; PD=progressive disease, SD=stable disease, MR= minor response, PR= partial response). Bone marrow was stained for the phosphorylated forms of mToR (C) and 4EBP1 (D) demonstrating a wide variety in activation of the pathway in plasma cells at baseline (dark gray bars). However, under treatment phosphorylation of mToR was abolished in all investigated samples (last biopsy: light gray bars) whereas activation of the downstream target 4EBP1 was only slightly decreased (n.d.= not done).

