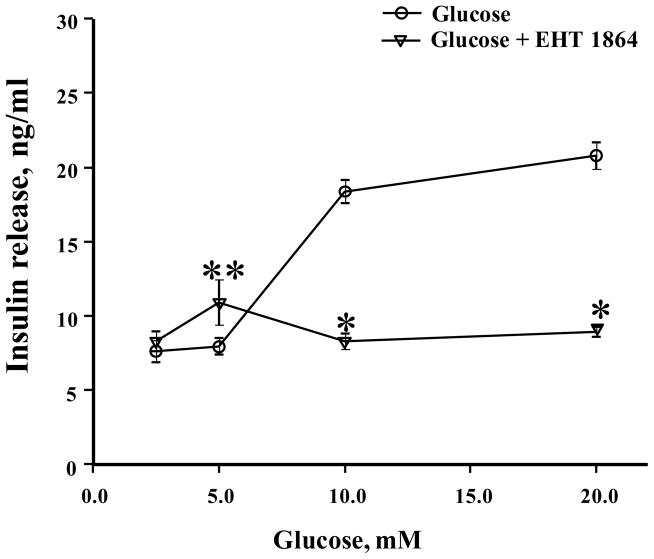
Figure 3. Effect of EHT 1864 on insulin secretion at different glucose concentrations in INS-1 832/13 cells.
INS-1 832/13 cells were cultured in RPMI media overnight in the presence of 2.5 mM glucose and 2.5% fetal bovine serum. After pre-incubation with EHT 1864 (10 μM) for 1 h, cells were incubated in the presence of different concentrations of glucose (0–20 mM) in the continuous absence or presence of EHT 1864 for 30 min at 37°C. The amount of insulin released was quantified by ELISA. The data was expressed as ng/ml ± SEM. * p < 0.05 vs. 10 mM or 20 mM glucose and ** p < 0.05 vs. 5 mM glucose.

