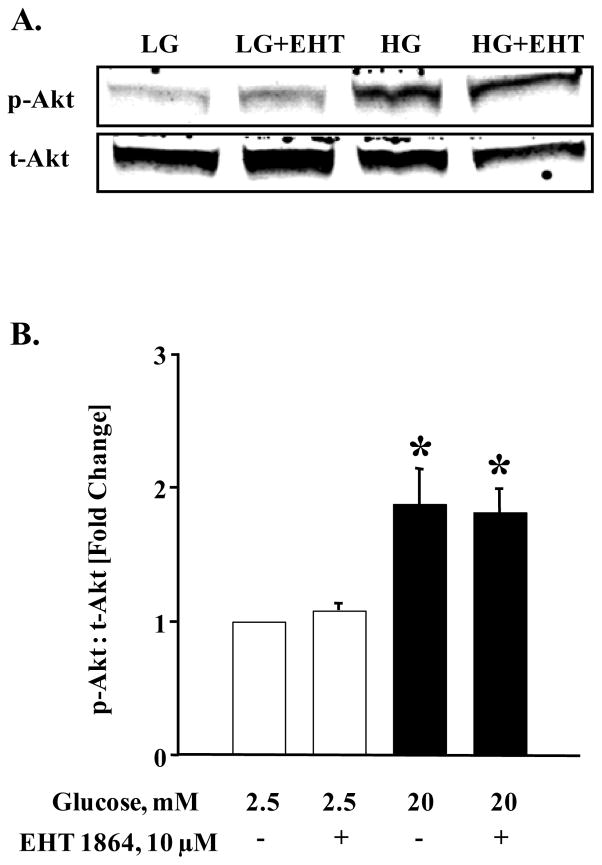
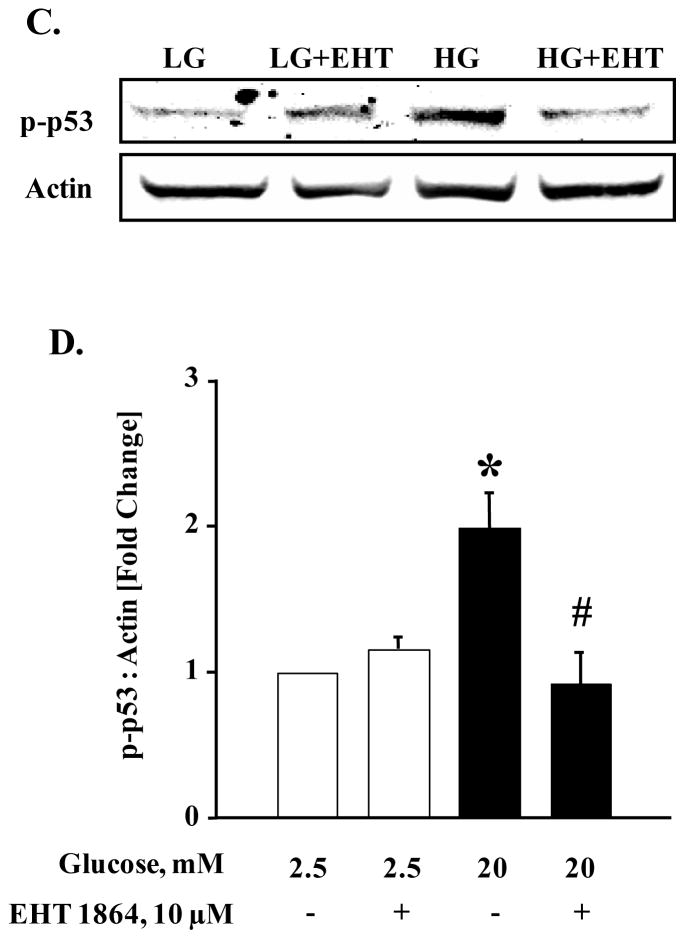
Figure 7. EHT 1864 significantly inhibited glucose-induced p53 phosphorylation but had no effect on phosphorylation of Akt.
INS-1 832/13 cells were starved overnight in RPMI media supplemented with 2.5 mM glucose and 2.5% fetal bovine serum. After pre-incubation with EHT 1864 (10 μM), cells were further stimulated with low (2.5 mM) or high glucose (20 mM) in the continuous absence or presence of EHT 1864 for 30 min at 37°C. Cells were then lysed and lysate proteins were separated by SDS-PAGE. Proteins were then transferred onto a nitrocellulose membrane, blocked and probed with antibody directed against phospho-Akt or phospho-p53. The membranes were then incubated with anti-rabbit secondary antibody. After detection, the same blots were stripped and re-probed with antibody directed against total-Akt or Actin (A, C). Band intensities were quantified by densitometric analysis (B, D). Results are shown as mean ± SEM from three independent experiments and expressed as fold change in the ratios between phospho-Akt and total-Akt or phospho-p53 and Actin. * p < 0.05 vs. 2.5 mM glucose alone or in presence of EHT 1864. # p < 0.05 vs. 20 mM glucose.


