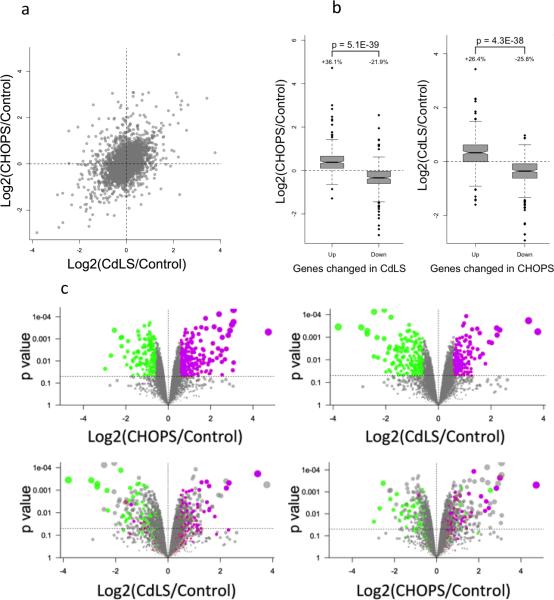
Figure 3.
Similar transcriptional profile between CHOPS syndrome and CdLS. (a) General comparison between CHOPS syndrome and CdLS demonstrated positive correlation between these two syndromes. (b) Top 250 dysregulated genes comparison. Left: Upregulated genes and downregulated genes in CdLS showed similar changes to CHOPS syndrome samples. Right: Dysregulated genes in CHOPS syndrome demonstrated similar changes to CdLS samples. The bottom of the box represents the 1st quartile, and the top of the box represents the 3rd quartile. The line in the middle of the box represents the median. The notches/whiskers demonstrate the confidence interval. (c) Volcano plots: Top left: volcano plots defining top 250 genes whose expression levels are higher (purple dots) and lower (green dots) in the CHOPs syndrome samples. These plots represent the top 250 genes that are either up- or down-regulated in the probands with the highest magnitude of difference and p < 0.05. Bottom left: Distribution of these 250 genes, whose expression is up- and down-regulated in CHOPS syndrome, in the CdLS samples. The same genes were labeled by the same colors in the bottom plot. Top right: Distribution of the top 250 genes whose expression was up- (purple dots) or down-regulated (green dots) in the CdLS syndrome samples. Bottom right: Distribution of these 250 genes, whose expression is up- or down-regulated in CdLS, in the CHOPS syndrome samples.

