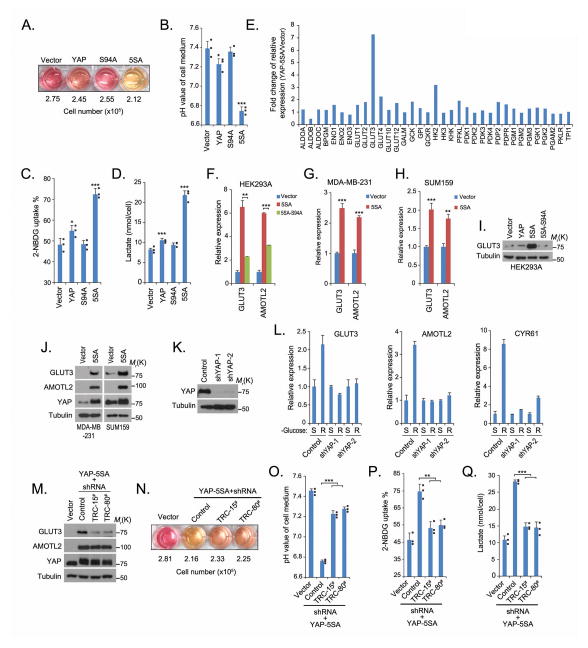
Figure 6. YAP regulates GLUT3 transcription in the glucose metabolic pathway.
(A–B) YAP activity increased the acidification of cell culture medium. The colour of the medium (A) varied in the same-time cultures of the indicated YAP-stable cell lines. The pH was measured (B) in cultures of the indicated YAP-stable cell lines (mean±s.d, n=3 biological replicates). * p<0.05 and *** p<0.001 (Student t-test). (C–D) YAP-5SA mutation promotes glycolysis. 2-NBDG uptake (C) and lactate production (D) were examined in indicated YAP stable cells (mean±s.d, n=3 biological replicate) as described in Methods. * p<0.05 and *** p<0.001 (Student t-test). (E) GLUT3 was identified as a YAP-regulated gene. The transcripts of glucose metabolism–related genes were detected by quantitative PCR in YAP-5SA cells and control vector–transfected cells. Fold increases are shown (mean, n=2 biological replicates). (F–H) The control of GLUT3 transcription by YAP was confirmed in various cell lines by quantitative PCR (mean±s.d, n=3 biological replicates). ** p<0.01 and *** p<0.001 (Student t-test). (I and J) YAP increased the level of GLUT3 protein in various cell lines. (K–L) Loss of YAP attenuated the increased GLUT3 expression in cells released from 16 hours of glucose starvation. The downregulation of YAP protein was confirmed by Western blotting (K). The transcription of GLUT3, AMOTL2 and CYR61 was detected by quantitative PCR in cells under glucose starvation or released from glucose starvation for 2 hours and normalised (mean±s.d, n=3 biological replicates). (M) GLUT3 was knockdown in YAP-5SA HEK293A cells by two different GLUT3 shRNAs. (N–O) GLUT3 knockdown suppressed the acidification of YAP-5SA cell medium. The colour of the medium varied in the cultures of the indicated cell lines (N). The pH was measured in the indicated cells (mean±s.d, n=3 biological replicates) (O). *** p<0.001 (Student t-test). (P–Q) Knockdown of GLUT3 suppressed YAP-5SA–induced glycolysis. 2-NBDG uptake (P) and lactate production (Q) were examined (mean±s.d, n=3 biological replicates) as described in Methods. ** p<0.01 and *** p<0.001 (Student t-test). Statistics source data are shown in Supplementary Table 2. Individual data are plotted for Figures 6B, 6C, 6D, 6O, 6P and 6Q. Uncropped images of Western blots are shown in Supplementary Figure 7.

