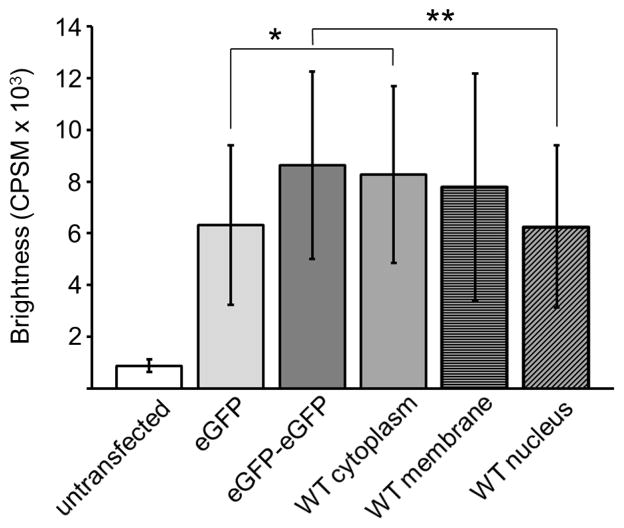
Fig. 5.
Molecular brightness of eGFP controls and WT-PAFAH-II-eGFP. Error bars show standard deviation and the asterisks show statistically significant difference between brightness of monomer eGFP and WT-PAFAH-II-eGFP in the cytoplasm (Student’s t test, p = 0.015). A significant difference of brightness was also observed between the dimer eGFP-eGFP and WT-PAFAH-II-eGFP in the nucleus (Student’s t test, p= 0.0068).

