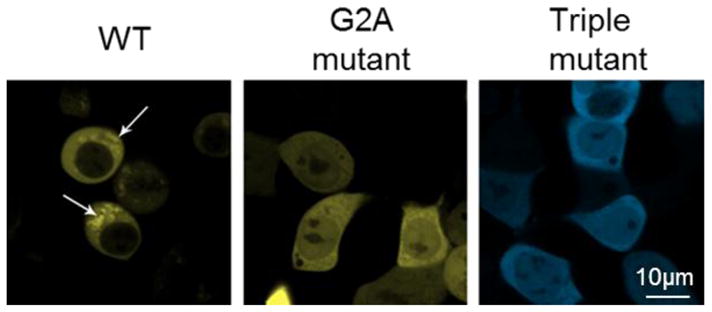
Fig. 7.

Confocal microscopy images of HEK293 cells expressing PAFAH-II WT, G2A and hydrophobic patch mutant fusions with fluorescent protein. Representative images showing WT-PAFAH-II-YFP, G2A-PAFAH-II-YFP, or Triple-mutant-PAFAH-II-CFP cellular locations. WT-PAFAH-II-YFP was evenly distributed in the cytoplasm and cytoplasmic membranes (shown by white arrows), while PAFAH-II levels were notably reduced inside the nucleus. In contrast, the G2A myristoyl mutant and the hydrophobic patch triple mutant (L327S/I328S/F331S) were evenly distributed in the cytoplasm and nucleus. This image was adapted from a figure of our previous work [12].
