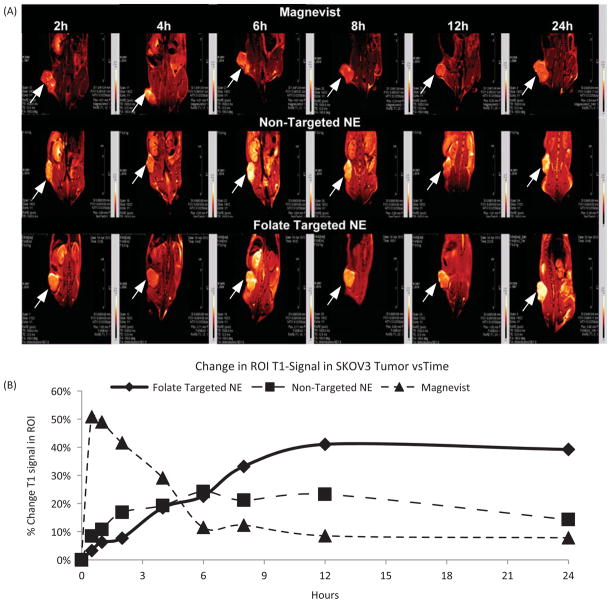
Figure 9.
(A)T1 weighted images and (B) quantitative analysis of % tumor signal versus time of mice bearing subcutaneous SKOV3 tumor xenograft post i.v. injection of magnevist, non-targeted NEs and folate-targeted NEs with pemetrexed treatment at final concentration of Gd at 0.072 mmoles/kg, the data are shown as mean ±SD (n=3).

