Figure 1.
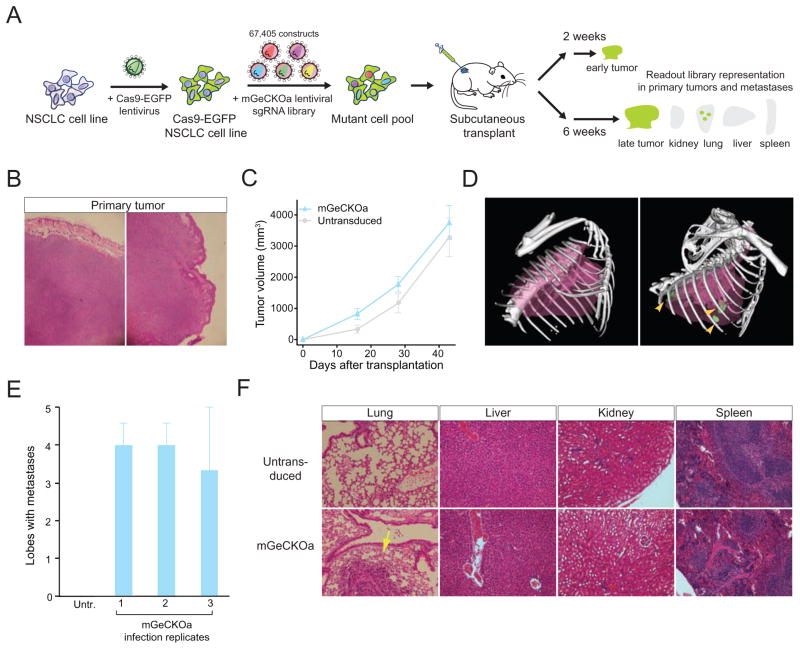
(A) Schematic representation of the loss-of-function metastasis screen using the mouse genome-scale CRISPR/Cas9 knock-out library (mGeCKOa).
(B) Representative hematoxylin and eosin (H&E) stains of primary tumor from Nu/Nu mice subcutaneously transplanted with a Cas9-GFP KrasG12D/+;p53−/−;Dicer1+/− (KPD) NSCLC cell line, untransduced or transduced mGeCKOa lentiviral library. Scale bar: 200 μm.
(C) Primary tumor growth curve of Nu/Nu mice transplanted with untransduced cells (n = 3 mice) or mGeCKOa-transduced Cas9-GFP KPD cells (n = 9 mice).
(D) Micro-CT 3D reconstruction of the lungs of representative mice transplanted with control (untransduced) and mGeCKOa-transduced (mGeCKOa) cell pools. Lung metastases were identified and traced in each 2D section (green).
(E) Percent of lobes with metastases visible after dissection under a fluorescence stereoscope, in Nu/Nu mice transplanted with untransduced Cas9-GFP KPD cells (n = 3 mice), or mGeCKOa-transduced Cas9-GFP KPD cells with three independent infection replicate experiments (R1, R2 and R3, n = 3 mice per replicate).
(F) Representative H&E stains from various organs of Nu/Nu mice subcutaneously transplanted with untransduced and mGeCKOa-transduced Cas9-GFP KPD cells. Yellow arrow indicates a lung metastasis. Scale bar: 40 μm.
(See also: Figure S1)

