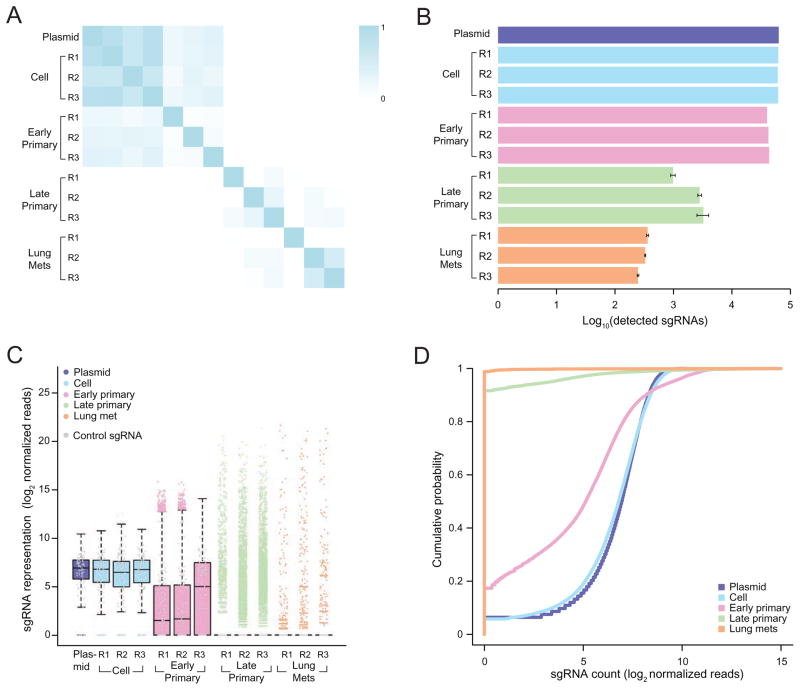
Figure 2.
(A) Pearson correlation coefficient of the normalized sgRNA read counts from the mGeCKOa plasmid library, transduced cells before transplantation (day 7 after spinfection), early primary tumors (~ 2 weeks after transplantation), late primary tumors (~ 6 weeks after transplantation), and lung metastases (~ 6 weeks after transplantation). For each biological sample type, 3 independent infection replicates (R1, R2 and R3) are shown. n = 1 mouse per infection replicate for early primary tumors and n = 3 mice per infection replicate for late primary tumors and lung samples.
(B) Number of unique sgRNAs in the plasmid, cells before transplantation, early and late primary tumors and lung metastases as in (A), Error bars for late primary tumors and lung metastases denote the s.e.m. for n = 3 mice per infection replicate.
(C) Boxplot of the sgRNA normalized read counts for the mGeCKOa plasmid pool, cells before transplantation, early and late primary tumors and lung metastases as in (A). Outliers are shown as colored dots for each respective sample. Gray dots overlayed on each boxplot indicate read counts for the 1,000 control (non-targeting) sgRNAs in the mGeCKOa library. Distributions for late primary tumors and lung metastases are averaged across individual mice from the same infection replication.
(D) Cumulative probability distribution of library sgRNAs in the plasmid, cells before transplantation, early and late primary tumors and lung metastases as in (A). Distributions for each sample type are averaged across individual mice and infection replications.
(See also: Figures S2 and S3)

