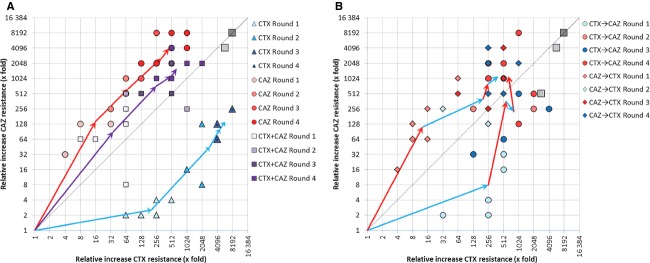
Figure 2.

Improvement in MIC of TEM-1 for CTX and CAZ during four rounds of evolution for all five experimental conditions. The arrows display the mean trajectory for each regime, and symbols show the individual values for each replicate line (blue for CTX, red for CAZ, and purple for the combined CTX + CAZ selection, from light to dark for round 1 to 4). (A) Adaptation in response to selection with CAZ and CTX alone, and in response to a combined exposure. (B) Adaptation in response to selection regimes in which CTX and CAZ are alternated, starting with either CAZ or CTX. The big gray squares indicate the maximum (dark) and median (light) expected resistance after four rounds of selection in the absence of pleiotropy; the shaded square in panel B gives this expectation for the fluctuating selection lines after comparable selection with each antibiotic (i.e., two rounds). Individual trajectories of experimental lines are given in Fig. S1A–E.
