
Figure 3. In vivo selection experiments.
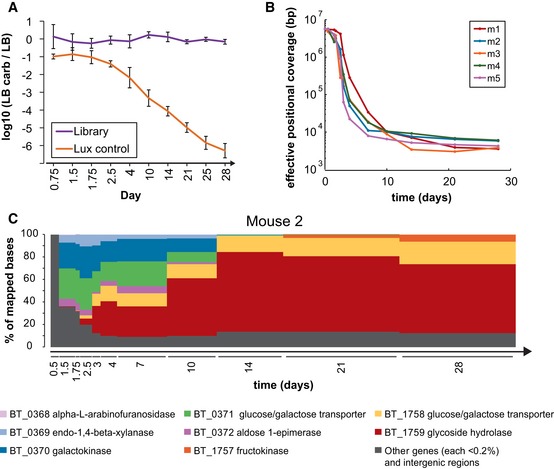
- Plasmid retention calculated by comparing number of colonies on LB versus LB + carbenicillin plates from mouse fecal samples. n = 5 mice; error bars = standard deviation.
- Effective positional coverage across the entire Bt genome for each mouse (m1–m5) begins with essentially even coverage of the Bt genome of ˜6 Mb, but drops rapidly over the experimental time‐course, representative of selection at specific loci.
- Representative longitudinal selection of Bt genes in a single mouse (Mouse 2). For each mouse and time point, ˜109 sequenced bases were mapped to the B. thetaiotaomicron genome. Of those mapped bases, the percentage mapping to each gene is plotted. Genes with < 0.2% are grouped together (dark gray bars).
Source data are available online for this figure.