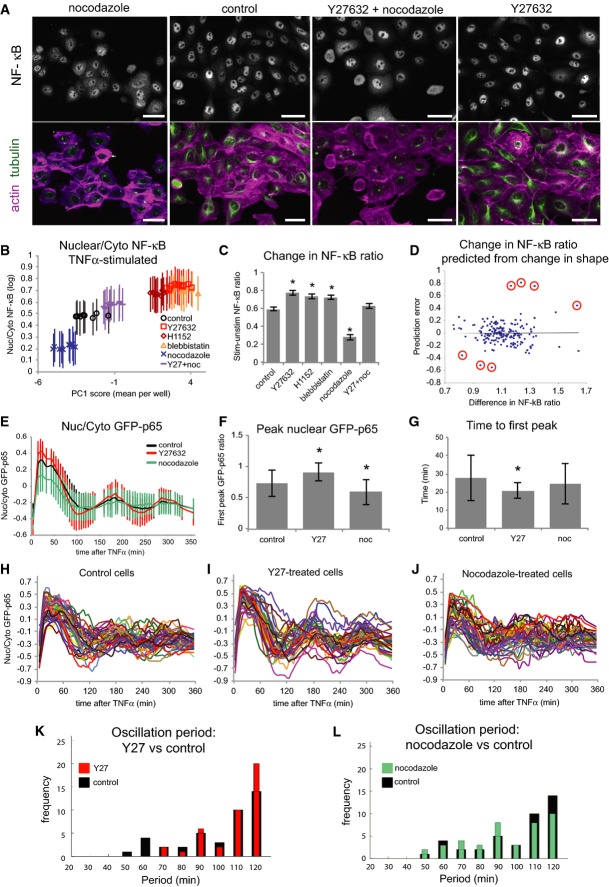
Figure 4.
- MCF10A cells ± Noc and/or Y27, in order of average PC1 scores from left to right as in (B). Scale bar = 20 μm.
- Average NF-κB ratio per well by average shape (PC1) score (+ TNFα) (± SD). n = 840 ± 48 cells/well.
- Fold change in NF-κB ratio between stimulated and unstimulated cells (± SD). n = 10 replicate wells/condition. *P < 0.01 compared with control (Student's t-test). n = 840 ± 48 cells.
- Fold change of NF-κB ratios predicted from changes in three cell shape features (NF, ruffliness, Anuc/Acyto) by multivariate regression analysis in 176 cell line/drug treatment conditions (Supplementary Tables S2 and S3 and Supplementary Dataset S3). Seven cases in which changes in cell shape did not accurately predict changes in NF-κB ratio are circled.
- Average nuclear/cytoplasmic GFP-p65 ratio at each time point in live cells (± SD). n = 40 cells/condition.
- Average amplitude of first peak GFP-p65 ratio (± SD). n = 40 cells/condition. *P < 0.01 (Student's t-test).
- Average time to first peak GFP-p65 ratio (± SD). n = 40 cells/condition. *P < 0.01 (Student's t-test).
- Single cell traces of GFP-p65 ratios over time (H–J). Wavelet analysis plots show frequencies of oscillation periods in Y27-treated (red) or Noc-treated (green) cells versus control (black) (t = 300 min) (K, L).

