Figure 5.
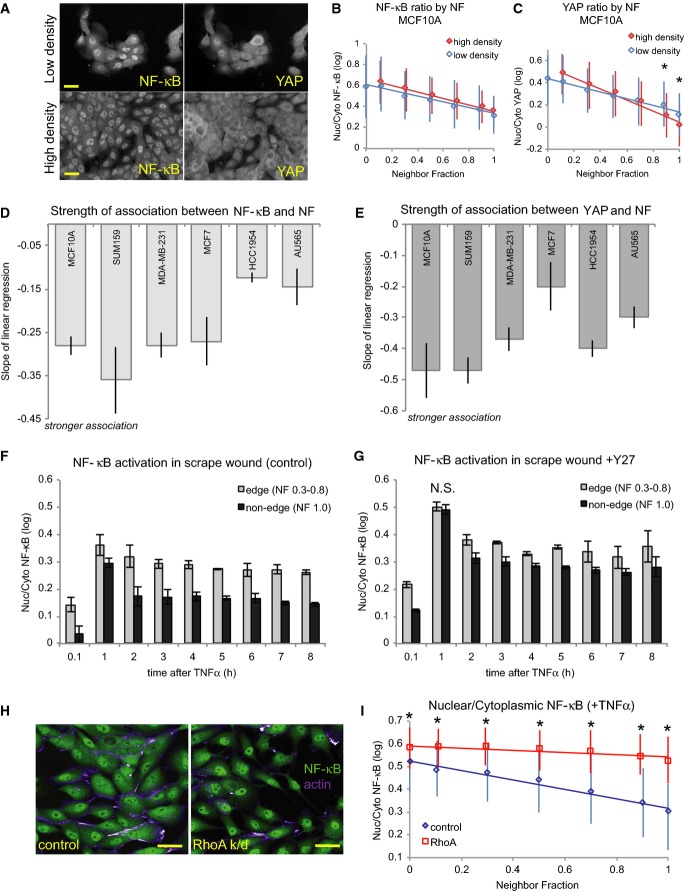
- A MCF10A cells plated at low and high densities. Scale bar = 20 μm.
- B, C MCF10A cells from high- and low-density cultures showing average NF-κB (B) and YAP (C) ratios by NF (± SD). All wells were treated with TNFα. *P < 0.01, difference between high- and low-density wells (Student's t-test).
- D, E Strength of the relationships between NF-κB ratio (D) or YAP ratio (E) and neighbor fraction shown by the slopes of the best-fit regression lines between TF ratio and NF (± SD). n = 4 density replicates (> 1,200 cells each) per line (see Supplementary Fig S5D and E).
- F, G NF-κB ratios in edge and non-edge cells of scrape-wounded monolayers of MCF10A cells stimulated with TNFα at the designated times after wounding in control (F) and Y27-treated (G) conditions. N.S. = no significant difference. Where not indicated otherwise, P < 0.01 between edge and non-edge cells (Student's t-test).
- H Mock-transfected (control) and RhoA-depleted (RhoA k/d) cells stimulated with TNFα (1 h) and stained for NF-κB (green) and F-actin (purple). Scale bar = 30 μm.
- I NF-κB ratio by NF for control and RhoA knockdown cells (± SD). n = 230 ± 90 cells/bin. *P < 0.01 (Student's t-test).

