
Figure 3.
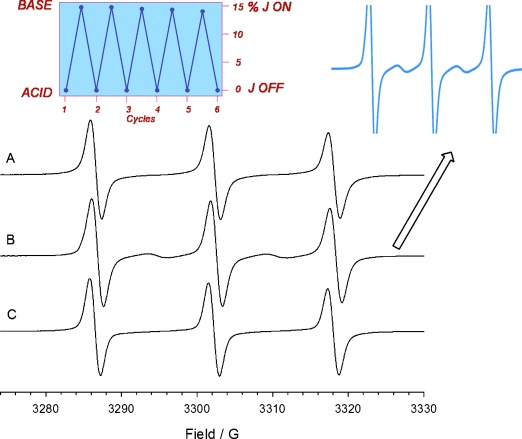
Room temperature EPR spectra of rotaxane 1 H⋅3 PF6 (0.15 mm) before (A) and after sequential addition of 2 equiv iPr2EtN (B) and CF3COOH (C). Right inset: enlargement of spectrum B showing exchange lines. Left inset: co-conformations (%) showing spin-exchange as function of sequential acid–base additions.