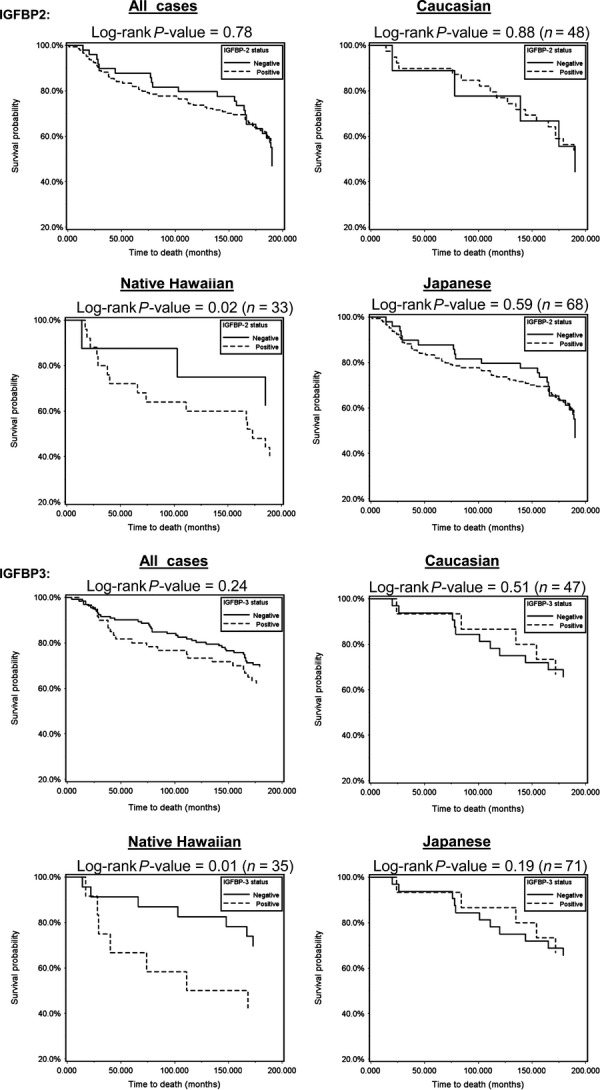
Figure 2.

Breast tumor tissue expression of IGFBP2 and IGFBP3 and breast cancer-specific survival. Kaplan–Meier curves and log-rank tests were used to compare survival distribution by protein expression of IGFBP2 and IGFBP3, without adjustment and up to 180 months of follow-up.
