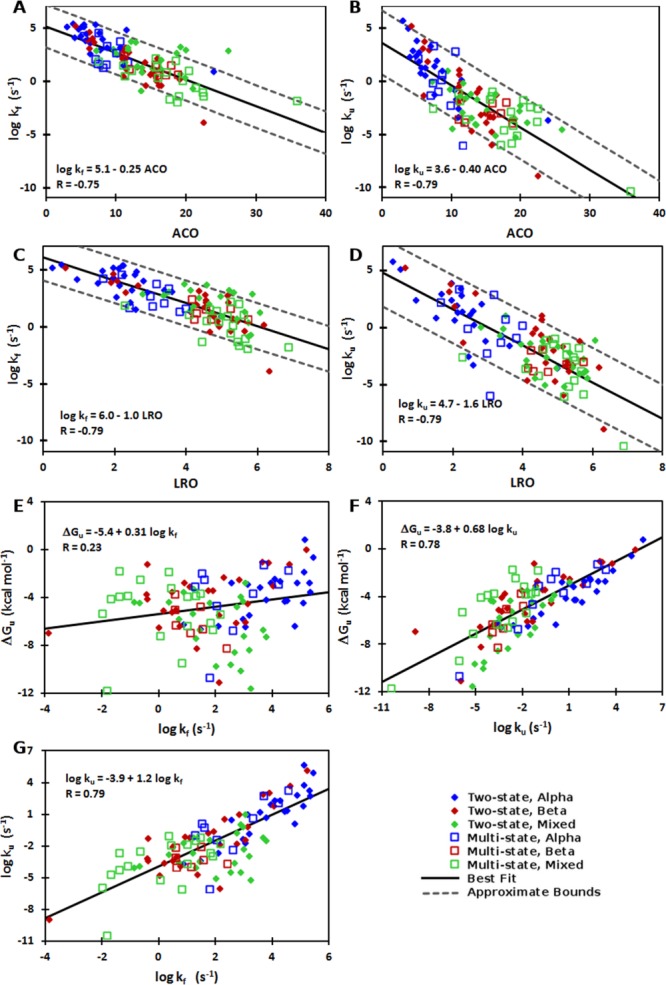
Figure 1.

Correlations between structural complexity, folding and unfolding rates, and thermodynamic stability. Correlations are shown between (A) folding rates and ACO, (B) unfolding rates and ACO, (C) folding rates and LRO, (D) unfolding rates and LRO, (E) folding rates and thermodynamic stability, (F) unfolding rates and thermodynamic stability, and (G) unfolding and folding rates. The lines of best fit (solid black) and corresponding equations and correlation values are given for the whole dataset, values for subsets of data are given in Table I for two-state (filled diamonds), multistate (open squares), alpha (blue), beta (red), and mixed (green) proteins. Dotted lines for panels A–D denote ±10-fold and ±100-fold variation in kf and ku, respectively.
