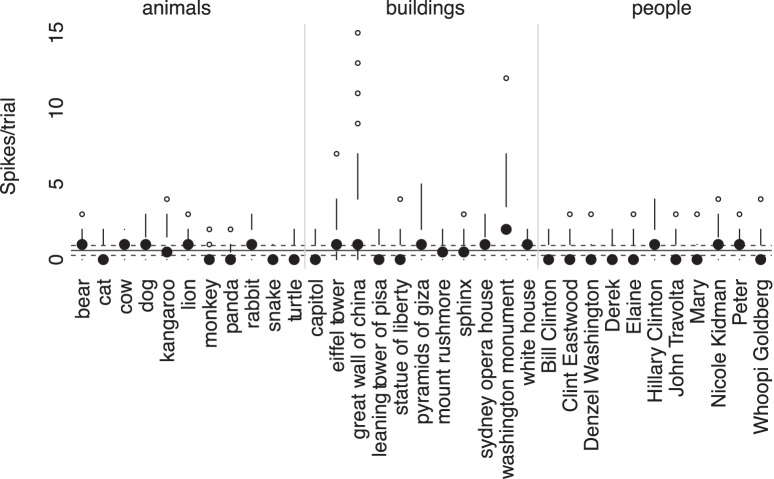
Figure 4.
Modified box-plot of distribution of responses to all objects shown for the same right hippocampal neuron shown in Figure 3. For each object, the solid dot shows the median response to presentation of an image of the object. Vertical lines extend from , (where IQR is interquartile range, n = number of observations, and 1.58 provides the equivalent to a 95% confidence interval for differences between medians; Chambers et al., 1983, their p. 62) to the data point furthest from the median, which is no more than ± (1.5 * IQR) beyond the first or third quartiles. Open circles show responses outside that range. Solid gray line shows the mean of background firing; dashed gray lines at of the background firing (n̄ = mean number of presentations of an object), representing a 95% confidence interval for the median of background firing. Thus median values above this line show strong responses relative to background firing for that specific object.

