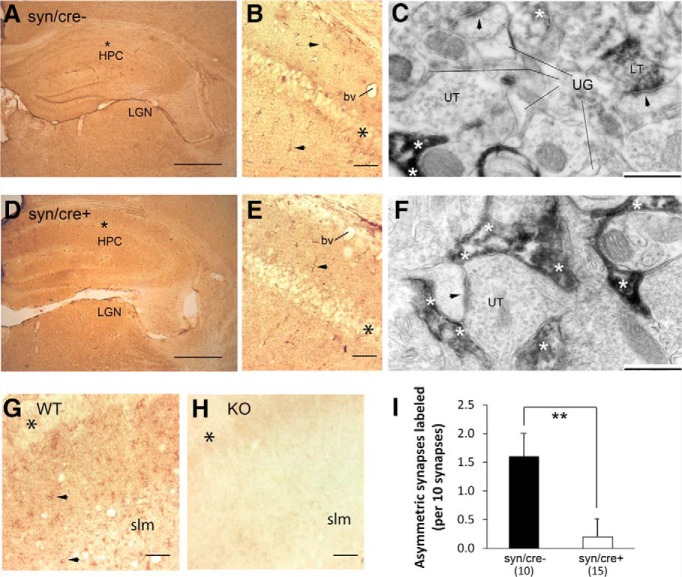
Figure 4.
Hippocampi with genetic deletion of GLT-1 in neurons exhibit reduced expression of GLT-1 in axons forming asymmetric synapses onto dendritic spines. D, E, LM-ICC labeling of GLT-1 in the hippocampi of animals with genetic deletion of GLT-1 within neurons (GLT-1Δ/Δ;Syn-Cre; referred to as syn/cre+), whereas A, B, show LM-ICC from GLT-1flox/flox littermates without Syn-Cre (referred to as syn/cre−). LM-ICC used the same monoclonal antibody as in previous figure, at a dilution of 1:10,000, and revealed dense labeling in all layers of the hippocampus (HPC), except for the pyramidal cell layer (A, B, D, E, G, H, black asterisks). At a higher-magnification, intense labeling of cells with morphological features of astrocytes (arrowheads) are evident throughout stratum radiatum (B) and stratum lacunosum-moleculare (slm; E). EM of the same brains (C, F) revealed the most intense labeling to be within astrocytic processes (white asterisks), many of which encircled asymmetric synapses with dark PSDs (C, F, arrowheads), indicating that these synapses were excitatory. Some of axons and presynaptic axon terminals forming asymmetric synaptic junctions within the syn/cre− tissue also exhibited GLT-1-immunoreactivity (C, LT). Most of the presynaptic axon terminals forming asymmetric synaptic junctions within syn/cre+ brains were unlabeled for GLT-1 (C, F, UT). Using the same antibody at the same dilution and processed in parallel with the syn/cre+ and syn/cre− tissue, LM-ICC of tissue with global knock-out of GLT-1 (Tanaka et al., 1997) exhibited no labeling throughout these layers of the hippocampus (H), whereas tissue collected from littermates without genetic deletion of GLT-1 revealed strong labeling (G). Quantitative analysis (I), conducted blind to genotype of tissue, using three syn/cre+ and two syn/cre− animals, confirmed reduction in the frequency of GLT-1-immunoreactivity within presynaptic axon terminals forming excitatory synaptic junctions onto spines in stratum radiatum (SR) of the hippocampus of syn/cre+ tissue (**p < 0.005 by the nonparametric K–S analysis). The values represent mean ± SEM. Calibration bars: A, D, 500 μm; B, E, G, H, 50 μm; C, F, 500 nm. bv, Blood vessels; slm, stratum lacunosum moleculare; LGN, lateral geniculate nucleus; UG, unlabeled glia.

