Figure 2.

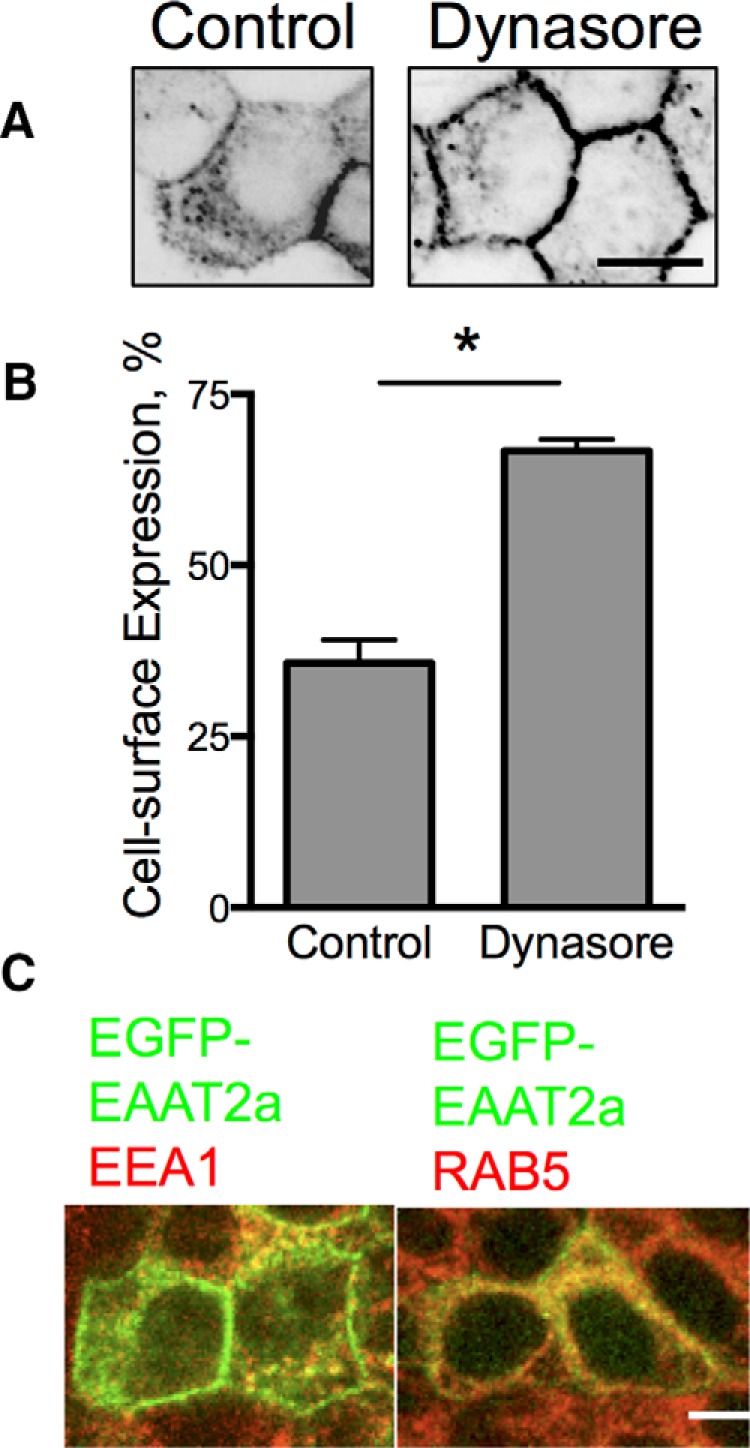
Localization of EAAT2a in MDCK cells. A, Confocal line scans through the middle of MDCK cells stably expressing EGFP-EAAT2a treated with vehicle (left) or dynasore (80 μm, right). B, Quantitation of the effects of blocking trafficking on surface expression of the carrier. *p < 0.0001 by one-way ANOVA (n = 6). Error bars indicate SEM. C, Confocal microscopy of immunolabeling for EEA1 and RAB5 (red) colocalize with EGFP-EAAT2a (green) in stably transfected MDCK cells. Scale bars: 50 μm.
