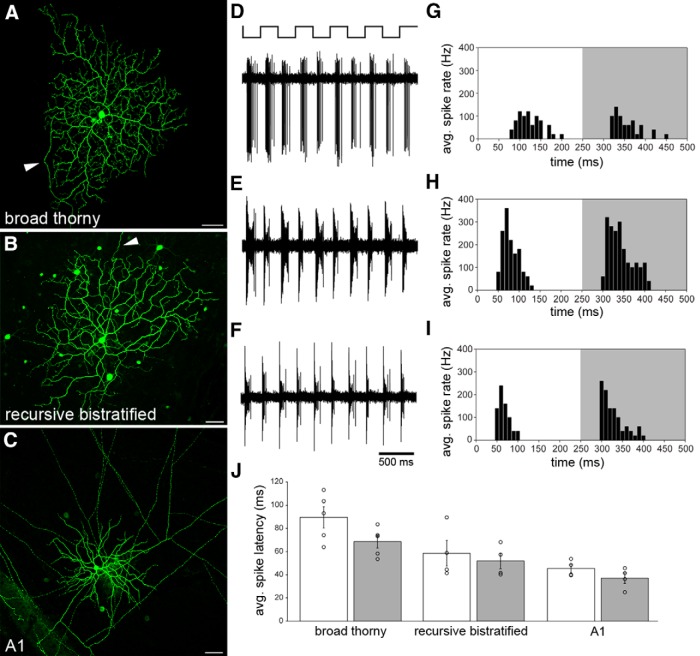
Figure 3.
Broad thorny cell light responses in comparison with other ON-OFF cells. A–C, Maximum intensity projections of confocal image stacks of a broad thorny ganglion cell injected with Lucifer yellow (A), a recursive bistratified ganglion cell injected with neurobiotin (B), and an A1 amacrine cell injected with Lucifer yellow (C). Arrowheads in A and B point to the axons of the ganglion cells. Several tracer-coupled somata appeared after neurobiotin injection and streptavidin labeling of recursive bistratified cells. In A1 amacrine cells, multiple straight axons (cropped at edges of the image) were observed, emanating from the circular-shaped dendritic field in the center of the image. Faintly labeled, tracer-coupled somata were also observed after injecting A1 amacrine cells with Lucifer yellow. Scale bars, 50 μm. D–F, Corresponding spike responses of the cells shown in A–C to a 2 Hz square-wave modulated spot presented to the receptive field center. G–I, Binned spike rate of the same cells as a function of time, averaged across the five stimulus cycles shown in D–F. The white and gray backgrounds indicate ON and OFF phases of the light response, respectively. J, Spike latency of ON (white) and OFF (gray) phases of light responses measured in five broad thorny cells, four recursive bistratified ganglion cells, and four A1 amacrine cells. Error bars represent 1 SEM.

