Figure 6.

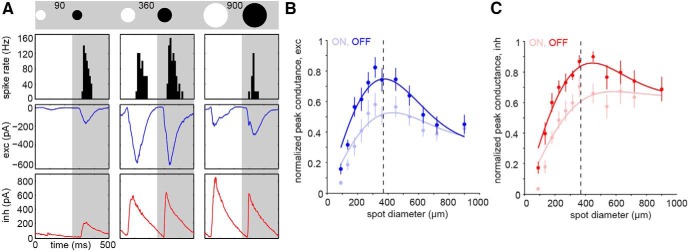
Synaptic inputs shaping the spike responses. A, The stimulus was a 2 Hz square-wave modulated spot at different spot diameters (90, 360, 900 μm; schematic on top). Top row, Binned spike rate (black) of a broad thorny cell to the stimulus indicated above the figure panel. Middle row, Excitatory currents (exc, blue) of the same cell. Bottom row, Inhibitory currents (inh, red). All responses were averaged across five stimulus cycles. Each box width indicates 500 ms. B, C, Normalized peak currents of excitatory (blue, n = 10) and inhibitory (red, n = 7) synaptic inputs to broad thorny cells as a function of spot diameter during ON and OFF phases of the light response. Error bars represent 1 SEM. Solid lines indicate DOG fits of the data, dashed line indicates the mean dendritic field size.
