
Figure 1.
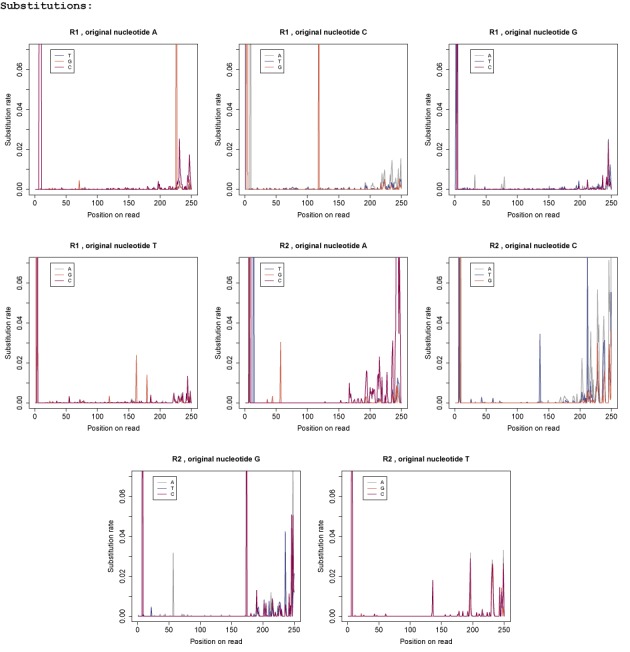
Nucleotide-specific substitution error profiles for data set DS 35: each graph shows the substitution rates for a specific original nucleotide and the colours indicate the substituting nucleotide. The first four graphs show the R1 profiles and the last four graphs show the R2 profiles.