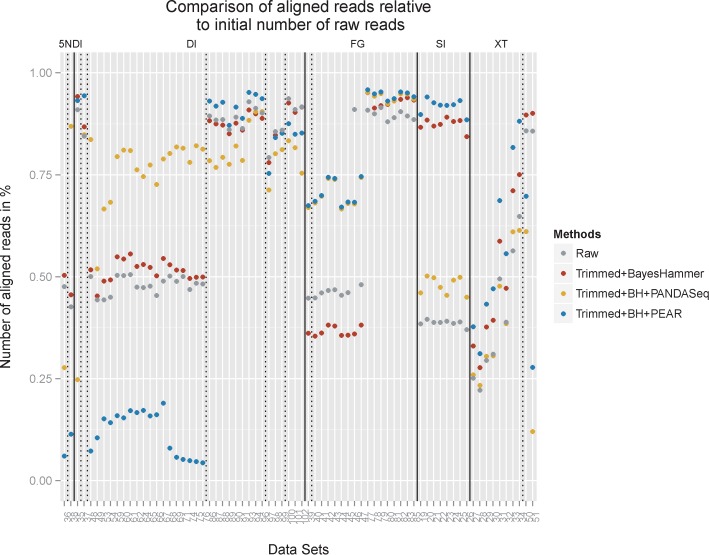
Figure 11.

The figure compares the number of aligned reads relative to the initial number of raw reads. For the raw reads and for reads that were processed with Sickle plus BayesHammer, we summed the R1 and R2 rates. We also included trimming plus BayesHammer and overlapping with PANDAseq and PEAR, respectively, as those combination of approaches returned the lowest error rates. Data sets are grouped by library preparation (solid line) and primers (dashed line).
