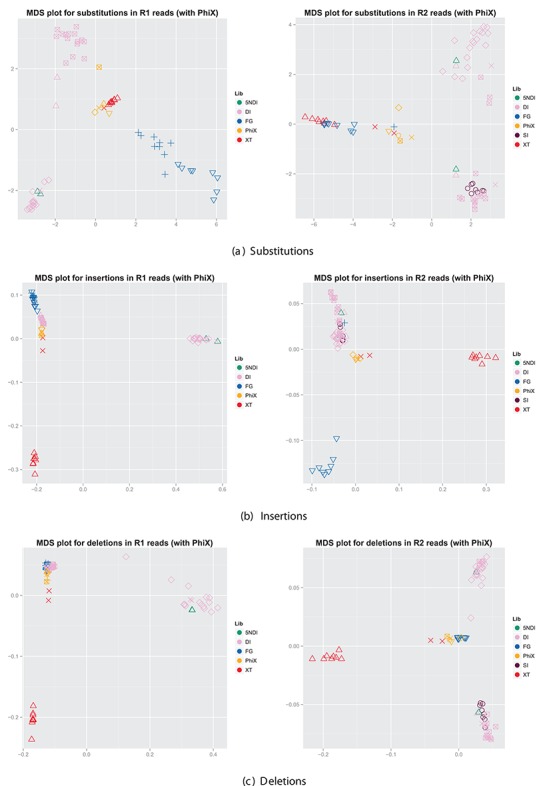
Figure 5.

Comparison of error distributions for all data sets. We used the Hellinger distance to construct similarity matrices for the error distributions and summed over all types of substitutions, insertions and deletions, respectively. The colour indicates the library preparation method (see the legend) and the shape indicates different runs.
